
Reason to trust
How Our News is Made
Strict editorial policy that focuses on accuracy, relevance, and impartiality
Ad discliamer
Morbi pretium leo et nisl aliquam mollis. Quisque arcu lorem, ultricies quis pellentesque nec, ullamcorper eu odio.
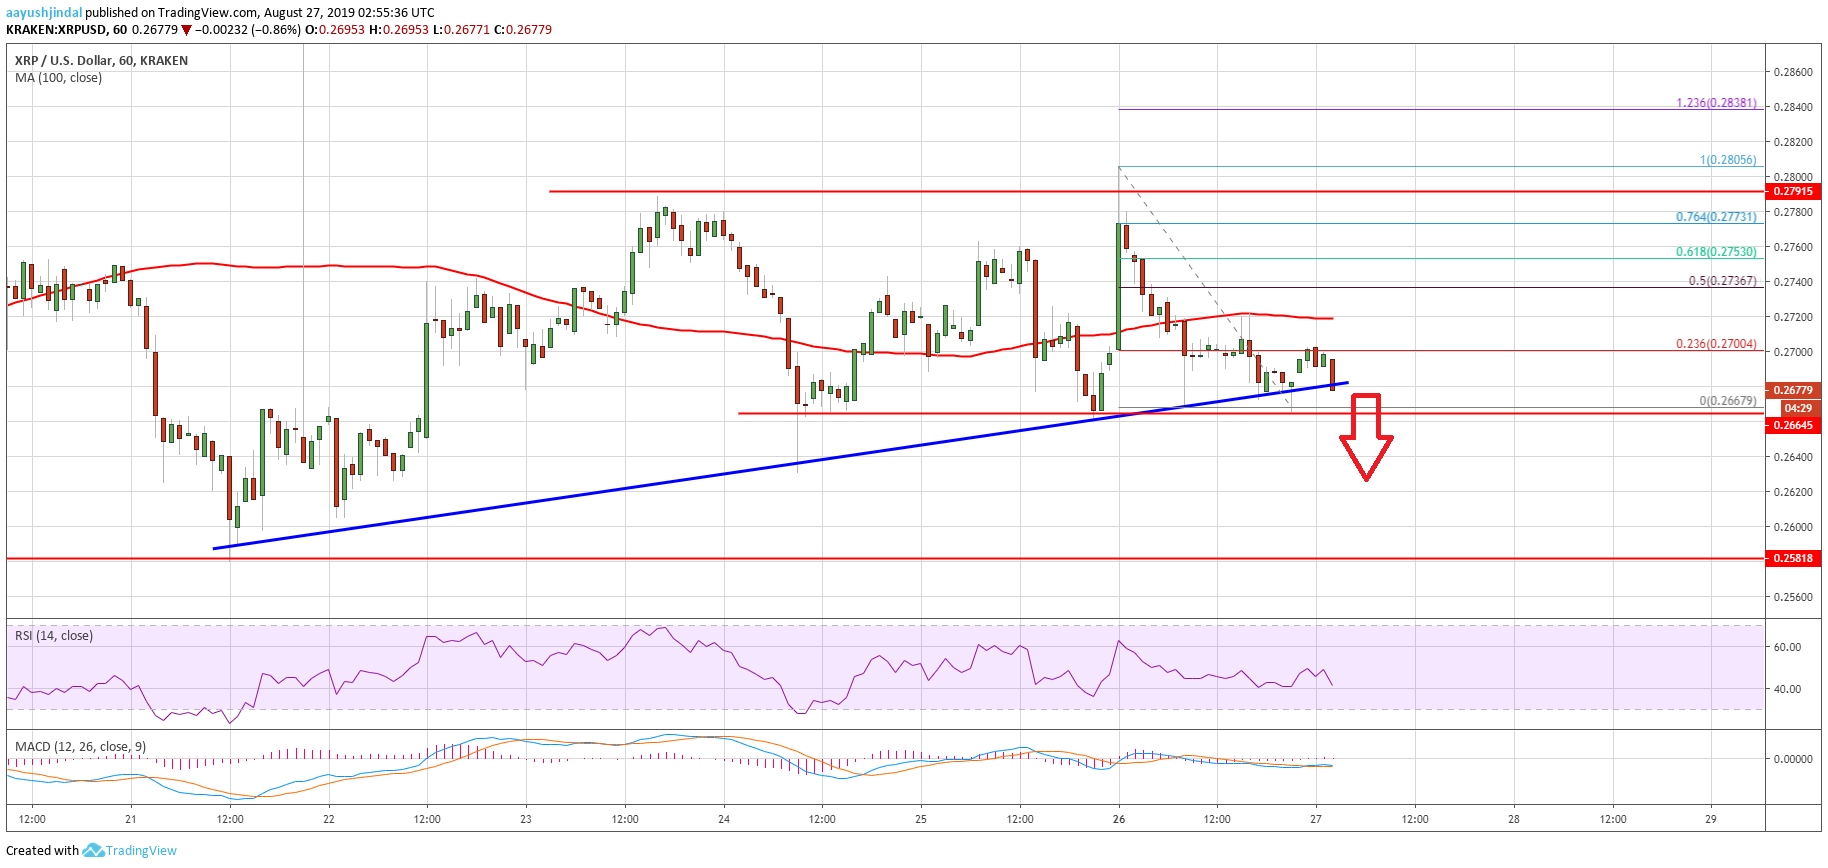
- Ripple price is struggling to climb higher above the $0.2750 and $0.2800 resistances against the US dollar.
- Bitcoin price failed to climb above the key $10,500 resistance level and declined recently.
- A major bullish trend line with support near $0.2670 is at risk on the hourly chart of the XRP/USD pair (data source from Kraken).
- The pair could accelerate its decline if there is a downside break below $0.2650 and $0.2620.
Ripple price is moving lower within a bearish zone against the US Dollar and bitcoin. XRP price remains at a risk of more downsides below the $0.2620 and $0.2580 supports.
Ripple Price Analysis
Yesterday, we saw a minor upward move in bitcoin, Ethereum and XRP against the US Dollar. Ripple climbed above the $0.2750 resistance and the 100 hourly simple moving average. However, the price struggled to gain traction above the $0.2800 level. As a result, the price started a fresh decline and traded below the $0.2750 support. Moreover, there was a break below the $0.2720 level and the 100 hourly simple moving average.
The price is now trading near the $0.2660 and $0.2650 support. Additionally, a major bullish trend line with support near $0.2670 is at risk on the hourly chart of the XRP/USD pair. If there is a downside break below $0.2650, the price could decline further. The next key supports are near $0.2620 and $0.2580. The recent low was formed near $0.2667 before the price attempted a recovery.
On the upside, an immediate resistance for ripple is near the $0.2700 level plus the 23.6% Fib retracement level of the recent decline from the $0.2805 high to $0.2667 low. The next key resistance is near the $0.2720 level since it coincides with the 100 hourly simple moving average. Moreover, the 50% Fib retracement level of the recent decline from the $0.2805 high to $0.2667 low is near $0.2735.
Therefore, there are a few key hurdles near the $0.2720 and $0.2740 levels. The next major resistance is near the $0.2800 level, above which the price could revisit the main $0.2900 resistance area. Conversely, if the price continues to weaken, it may even trade below the $0.2580 support.
Looking at the chart, ripple price is slowly moving into a bearish zone and it may soon break the trend line and $0.2650. In the mentioned bearish case, there are high chances of a downside break below the $0.2580 support.
Technical Indicators
Hourly MACD – The MACD for XRP/USD is gaining momentum in the bearish zone.
Hourly RSI (Relative Strength Index) – The RSI for XRP/USD is now below 50 and is moving lower towards 30.
Major Support Levels – $0.2650, $0.2620 and $0.2580.
Major Resistance Levels – $0.2720, $0.2740 and $0.2800.