Reason to trust

How Our News is Made
Strict editorial policy that focuses on accuracy, relevance, and impartiality
Ad discliamer
Morbi pretium leo et nisl aliquam mollis. Quisque arcu lorem, ultricies quis pellentesque nec, ullamcorper eu odio.
Following Bitcoin price setting its all-time high at $20,000, the entire crypto hype bubble began to pop and both Bitcoin and altcoins began dropping in value.
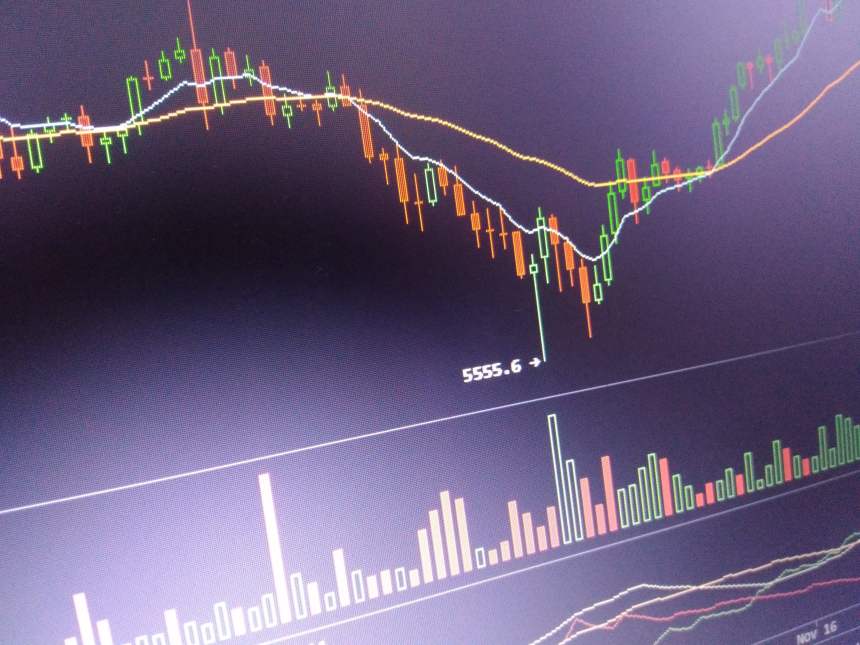
After support from Bitcoin’s parabolic advance was broken, Bitcoin price suffered a severe, V-shaped crash from $13,000 all the way down to $5,800 before bouncing right back up to over $11,000. According to one crypto analyst, a similar drop is a “reasonable possibility,” if Bitcoin price breaks below current support.
Break Below Current Support Could Create Feb 2018 Style V-Bottom
Parabolic rallies correct hard. The 2017 crypto bubble pop led to Bitcoin price falling over 85% to its eventual bottom at $3,200, down from its previous all-time high of $20,000.
Related Reading | Bitcoin Price Closes Two Consecutive Weekly Red Candles, First Time Since Bottom
At the start of April 2019, Bitcoin went parabolic yet again, taking its price from the $3,000 to $4,000 range, all the way to $13,800 before it was rejected at the resistance level that kicked off the bear market in the first place. After gains of over 300%, a correction was not only likely but healthy.
Since then, Bitcoin price has ranged between highs over $12,000 and lows under $10,000, with $10,000 acting as base support. According to one crypto analyst, who has been warning that a deeper correction in Bitcoin has been overdue, is now suggesting that if current support breaks, a sharp, February 2018-style crash is a “reasonable possibility.”
Unless you're wearing a set of moonboy blinkers, you're going to see something like this as a reasonable possibility. pic.twitter.com/tH6m78ODrS
— dave the wave🌊🌓 (@davthewave) August 27, 2019
Before crypto investors panic of the ominous warning, the analyst, who focuses on moving averages and other long-term trend indicators such as the MACD or Gaussian channel, doesn’t believe that Bitcoin is in for another bear market. In fact, the analyst has repeatedly shared charts that demonstrate that Bitcoin price may never have been in a bear market at all, and has long been in a “secular” bull market.
Bitcoin Price Could Retrace to Next Fibonacci Levels
As of now, the current correction has barely reached the “first fib level,” a price point mathematically based on the Fibonacci ratios, that often act as a target for rallies and retracements in various assets.
Bitcoin is volatile.
After a massive 300% spike, itself after a massive correction, it has barely corrected the first fib level…. pic.twitter.com/CbspPpnx2X
— dave the wave🌊🌓 (@davthewave) August 23, 2019
The fib level being referenced is the 0.236 fib level. Next after the current level would be 0.382 and 0.5. The 0.382 retracement level would take Bitcoin price down to between $7,500 and $8,500, while 0.5 would be a correction to between $7,500 and $6,000.
Support at $6,000 acted as the base support throughout most of 2018. In November, it ultimately gave way and Bitcoin found its true bottom. But after Bitcoin broke back above $6,000, is never came back down to confirm the former based as support turned resistance, turned back to support.
Related Reading | Can Ancient Math Predict the Next Bitcoin Top at $220K?
If the 0.5 fib level is reached, Bitcoin price may finally retest $6,000 to reconfirm it as support, and after it does, the bull run can resume.


