
Reason to trust
How Our News is Made
Strict editorial policy that focuses on accuracy, relevance, and impartiality
Ad discliamer
Morbi pretium leo et nisl aliquam mollis. Quisque arcu lorem, ultricies quis pellentesque nec, ullamcorper eu odio.
- Bitcoin price struggled to gain above $10,500 and declined below $10,300 against the US Dollar.
- The price is currently trading in a bearish zone below the $10,350 and $10,500 resistances.
- There is a rising channel or a bearish flag forming with support near $10,040 on the hourly chart of the BTC/USD pair (data feed from Kraken).
- The price could decline sharply if there is a downside break below the $10,000 support.
Bitcoin price is facing a lot of hurdles near $10,400 and $10,500 against the US Dollar. Therefore, BTC could continue to move down below $10,200 and $10,000.
Bitcoin Price Analysis
Yesterday, we saw a solid upward move in bitcoin above $10,250 against the US Dollar. The price even traded above the $10,400 level and the 100 hourly simple moving average. Finally, the price surpassed $10,500, but it struggled to retain gains. As a result, the price topped near $10,697 and later started a fresh decline. It broke the $10,500 and $10,400 levels to move back into a bearish zone.
Moreover, there was a break below the $10,300 level and 100 hourly simple moving average. A swing low was formed near $10,095 and the price is currently consolidating losses. An immediate resistance is near the $10,200 level and the 100 hourly simple moving average. Additionally, the 23.6% Fib retracement level of the recent decline from the $10,697 high to $10,095 low is also near $10,235. The next key resistance is near the $10,350 level and a connecting bearish trend line on the hourly chart.
Above the trend line, the next resistance is near $10,400. It coincides with the 50% Fib retracement level of the recent decline from the $10,697 high to $10,095 low. The main resistance for bitcoin is near the $10,500 level. A successful daily close above $10,500 is needed for a solid upward move. Besides, there is a rising channel or a bearish flag forming with support near $10,040 on the hourly chart of the BTC/USD pair.
If there is a downside break below the channel support, the price could even break the $10,000 support. The next key support is near the $9,800 area, below which there is a risk of a sharp decline towards $9,500 and $9,250.
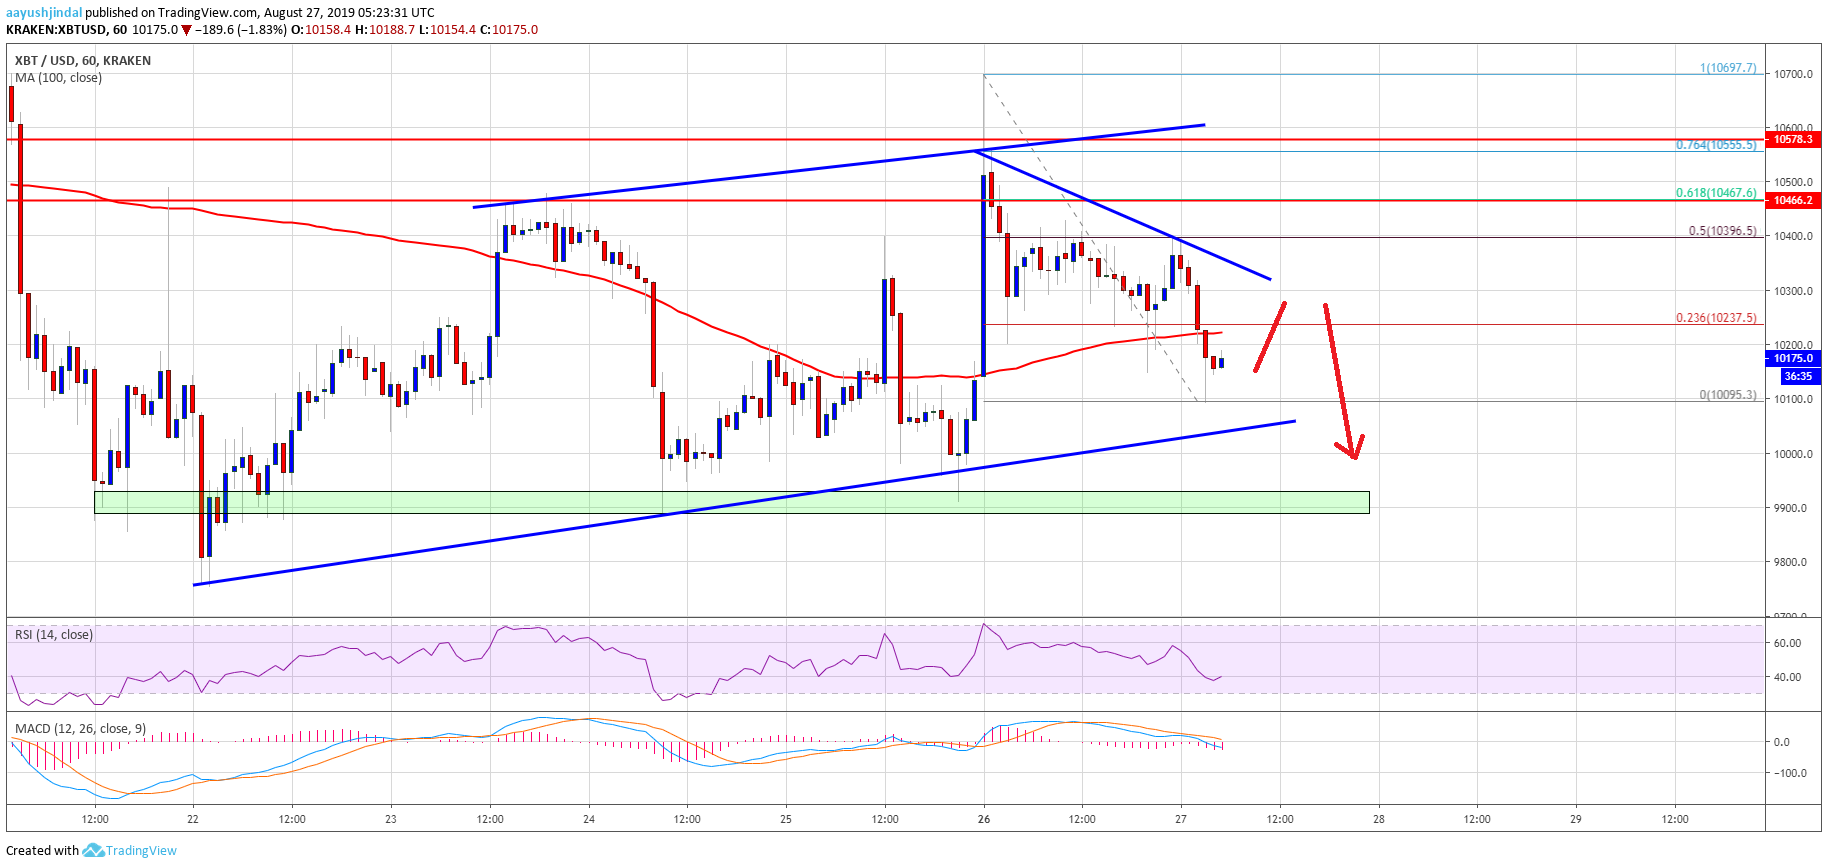
Looking at the chart, bitcoin price is clearly trading in a bearish zone below the $10,400 and $10,500 levels. Overall, if the price continues to struggle, the bears are likely to aim a break below $9,800.
Technical indicators:
Hourly MACD – The MACD is currently gaining pace in the bearish zone.
Hourly RSI (Relative Strength Index) – The RSI for BTC/USD is now well below the 50 level.
Major Support Levels – $10,000 followed by $9,800.
Major Resistance Levels – $10,300, $10,400 and $10,500.