
Reason to trust
How Our News is Made
Strict editorial policy that focuses on accuracy, relevance, and impartiality
Ad discliamer
Morbi pretium leo et nisl aliquam mollis. Quisque arcu lorem, ultricies quis pellentesque nec, ullamcorper eu odio.
- ETH price remained in a bearish zone and even tested the $180 support area against the US Dollar.
- The price is currently correcting higher, but it is facing hurdles near $192 and $195.
- There is a significant bearish trend line forming with resistance near $192 on the 4-hours chart of ETH/USD (data feed via Kraken).
- An upside break above $192 and $195 might trigger a solid recovery in the near term.
Ethereum price is currently facing a strong resistance against the US Dollar and bitcoin. ETH remains at a risk of more downsides until there is a daily close above $200.
Ethereum Price Weekly Analysis
This past week, there were bearish moves in ETH below the $210 and $200 supports against the US Dollar. Moreover, the price settled below the $200 level and the 100 simple moving average (4-hours). Additionally, there were bearish moves in bitcoin below $10,000 and ripple price settled below the key $0.290 support level. At the moment, the market is correcting higher, but facing many hurdles such as ETH near the $192 and $195 levels.
Ethereum price traded as low as $180 recently and it is currently correcting higher. It recovered above the 50% Fib retracement level of the recent decline from the $204 high to $180 swing low. However, the upward move was capped by the $195 resistance area. Moreover, the 61.8% Fib retracement level of the recent decline from the $204 high to $180 swing low acted as a resistance.
It seems like there is a strong resistance forming near $192 and $195. More importantly, there is a significant bearish trend line forming with resistance near $192 on the 4-hours chart of ETH/USD. The main resistance is near the $198 and $200 levels. The 100 simple moving average (4-hours) is also positioned near the $200 level. Therefore, an upside break above the $200 level might trigger a strong recovery.
Conversely, if there is no upside break above $195 or $198, the price could is likely to continue lower. An immediate support is near the $185 level. However, the main support is near the $180 level, below which there is a risk of a sharp decline in the near term.
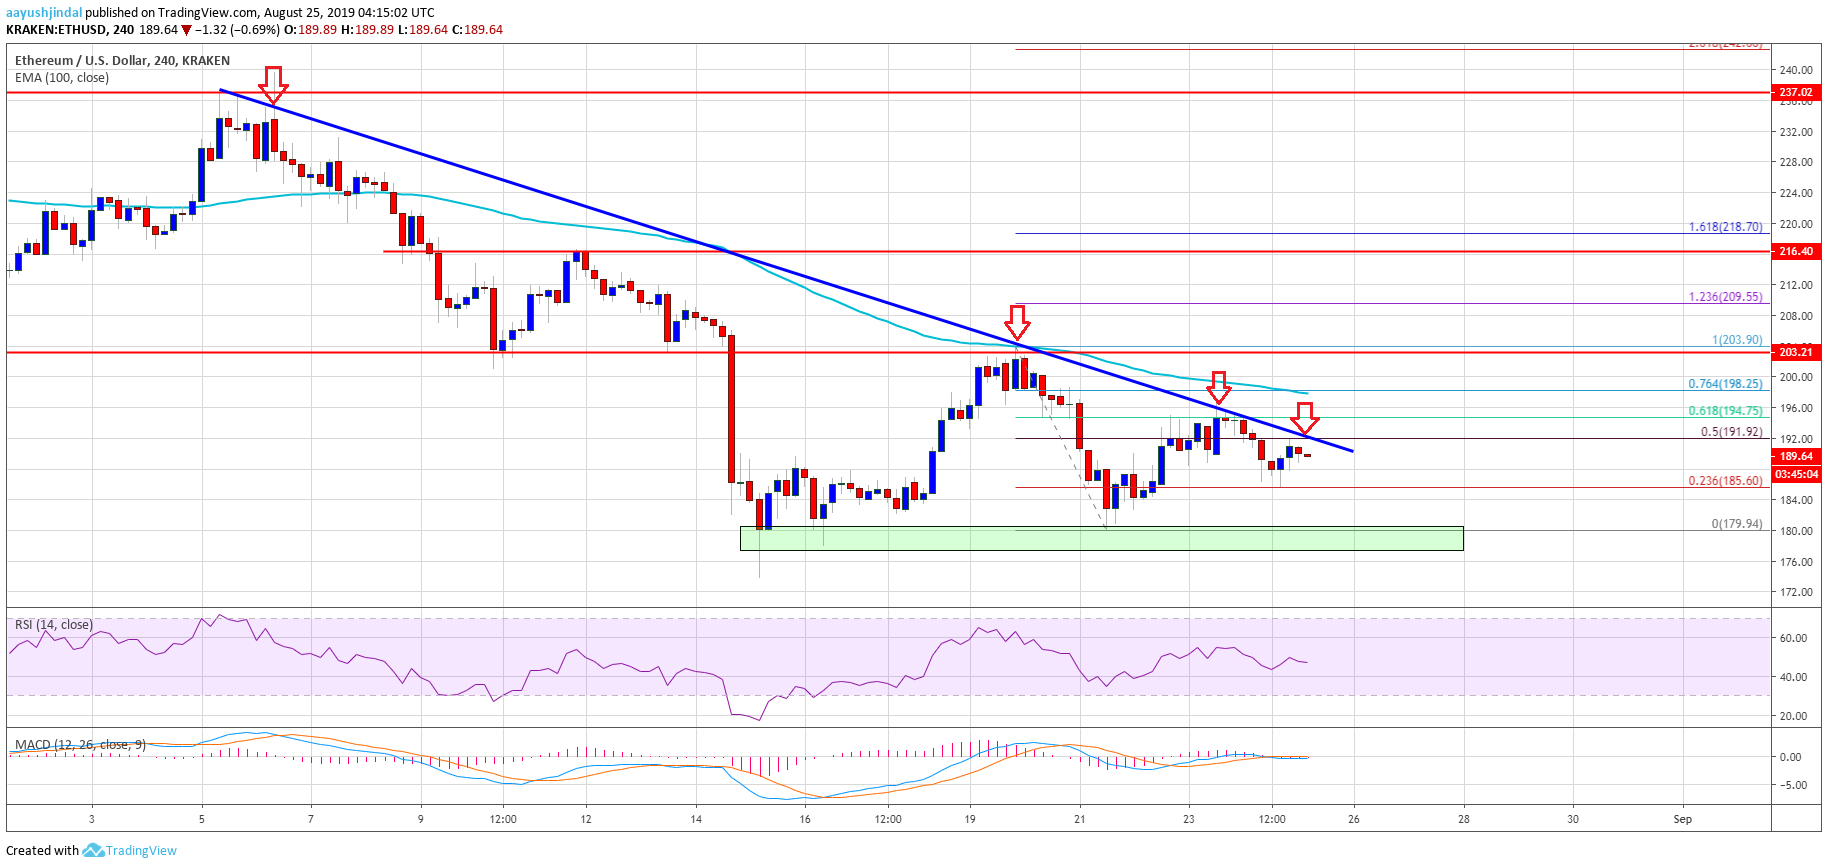
The above chart indicates that Ethereum price is clearly trading near a crucial juncture at $192. If there is an upside break, the price could start a decent recovery. If not, there are chances of another bearish wave below $180.
Technical Indicators
4 hours MACD – The MACD for ETH/USD is showing no positive signs in the bearish zone.
4 hours RSI – The RSI for ETH/USD is currently near the 45 level, with a bearish angle.
Major Support Level – $180
Major Resistance Level – $198