Reason to trust
How Our News is Made
Strict editorial policy that focuses on accuracy, relevance, and impartiality
Ad discliamer
Morbi pretium leo et nisl aliquam mollis. Quisque arcu lorem, ultricies quis pellentesque nec, ullamcorper eu odio.
- Bitcoin price is currently correcting higher above the $10,000 resistance against the US Dollar.
- The price is facing many key resistances near the $10,250, $10,300 and $10,400 levels.
- There is also a connecting bearish trend line forming with resistance near $10,450 on the hourly chart of the BTC/USD pair (data feed from Kraken).
- The price is likely to face a strong selling interest near the $10,300 and $10,400 levels.
Bitcoin price is slowly correcting towards $10,300 against the US Dollar. However, BTC will most likely fail to continue above $10,300 or 10,400 in the near term.
Bitcoin Price Analysis
Recently, there was a sharp decline in BTC below the $10,000 support against the US Dollar. The price even traded below $9,800 and settled well below the 100 hourly simple moving average. Finally, the previous support area near $9,750 acted as a support and prevented additional weakness. As a result, there was an upside correction initiated above the $10,000 resistance area.
Moreover, there was a break above the 23.6% Fib retracement level of the main drop from the $10,976 high to $9,757 low. The price is now trading near the $10,200 resistance level. On the upside, there are many resistances near $10,250 and $10,300 levels. Additionally, there is a connecting bearish trend line forming with resistance near $10,450 on the hourly chart of the BTC/USD pair.
The 50% Fib retracement level of the main drop from the $10,976 high to $9,757 low is also waiting near the $10,370 level. Finally, the 100 hourly SMA is close to $10,380 to act as a hurdle for the bulls. Therefore, an upside correction towards the $10,250, $10,300 and $10,350 levels could face a strong selling interest in the near term. If there is no upside break, bitcoin is likely to resume its decline below the $10,000 support.
An immediate support is near the $9,920 level, below which the price is likely to revisit the $9,750 support area. Any further decline may perhaps push the price towards the $9,500 support level in the coming sessions.
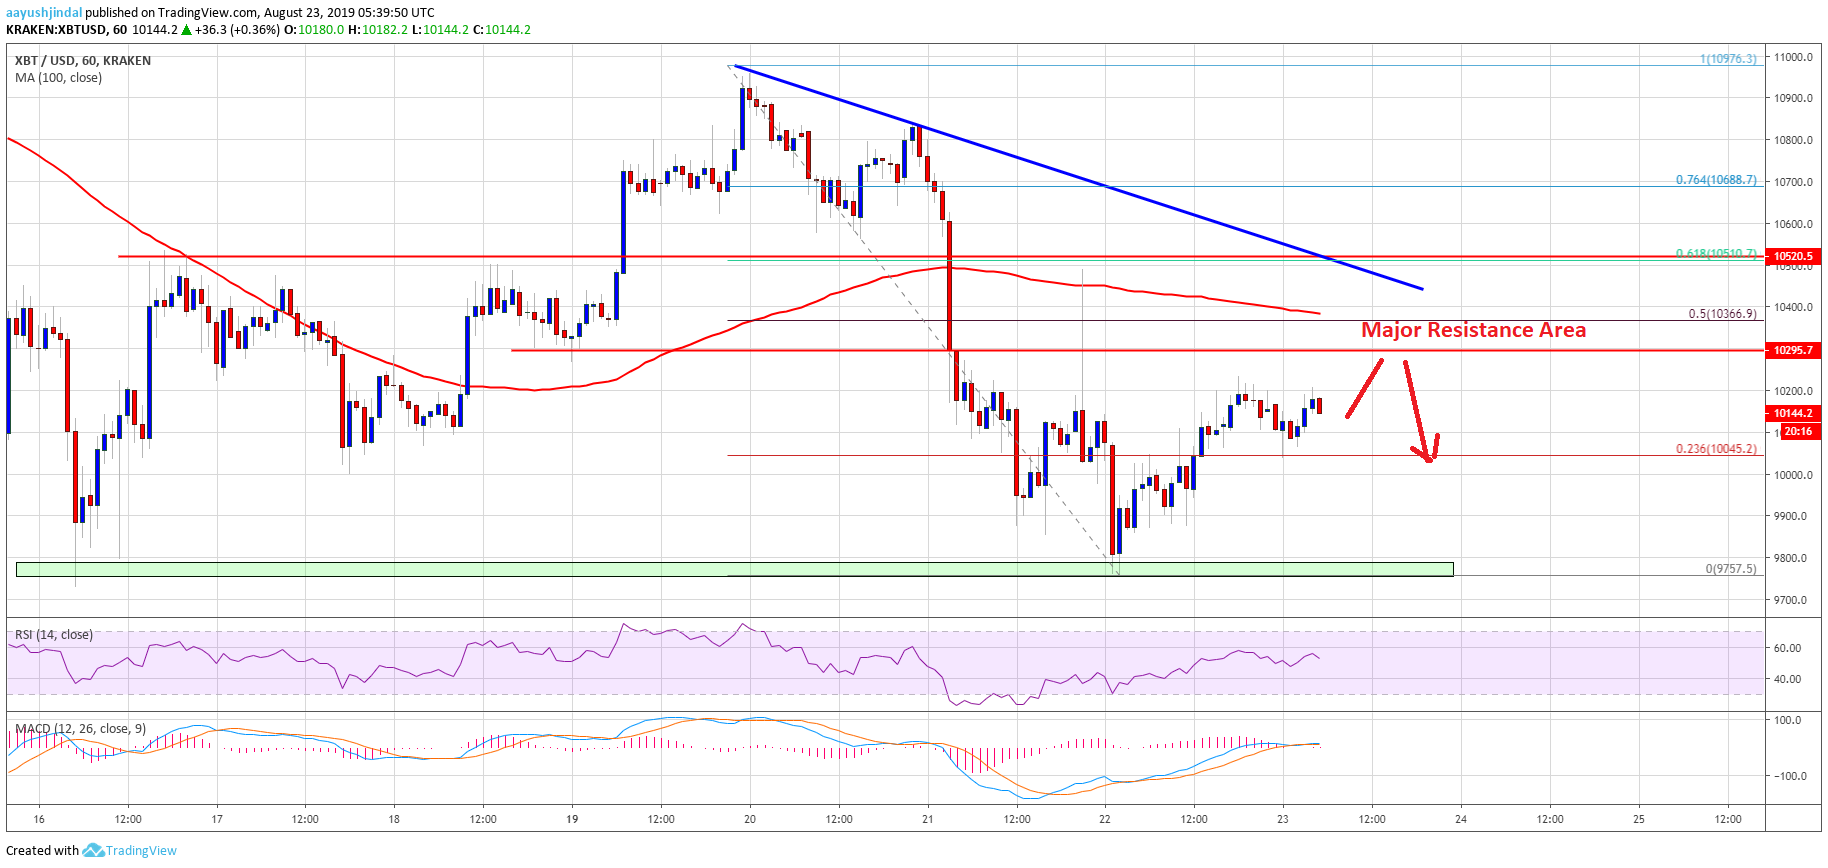
Looking at the chart, bitcoin price seems to be correcting higher towards the main barrier near the $10,300 and $10,400 levels. A successful close above the $10,400 level and the 100 hourly SMA may perhaps lead the price towards the $10,600 and $10,700 resistance levels. If not, there are high chances of a fresh decrease below the $10,000 and $9,850 levels.
Technical indicators:
Hourly MACD – The MACD is likely to move back into the bearish zone.
Hourly RSI (Relative Strength Index) – The RSI for BTC/USD is currently declining towards the 50 level.
Major Support Levels – $10,000 followed by $9,750.
Major Resistance Levels – $10,200, $10,250 and $10,300.