
Reason to trust
How Our News is Made
Strict editorial policy that focuses on accuracy, relevance, and impartiality
Ad discliamer
Morbi pretium leo et nisl aliquam mollis. Quisque arcu lorem, ultricies quis pellentesque nec, ullamcorper eu odio.
- Ripple price is following a bearish path and it recently broke the $0.2700 support against the US dollar.
- Bitcoin price is down around 8% and it settled below the key $10,000 support area.
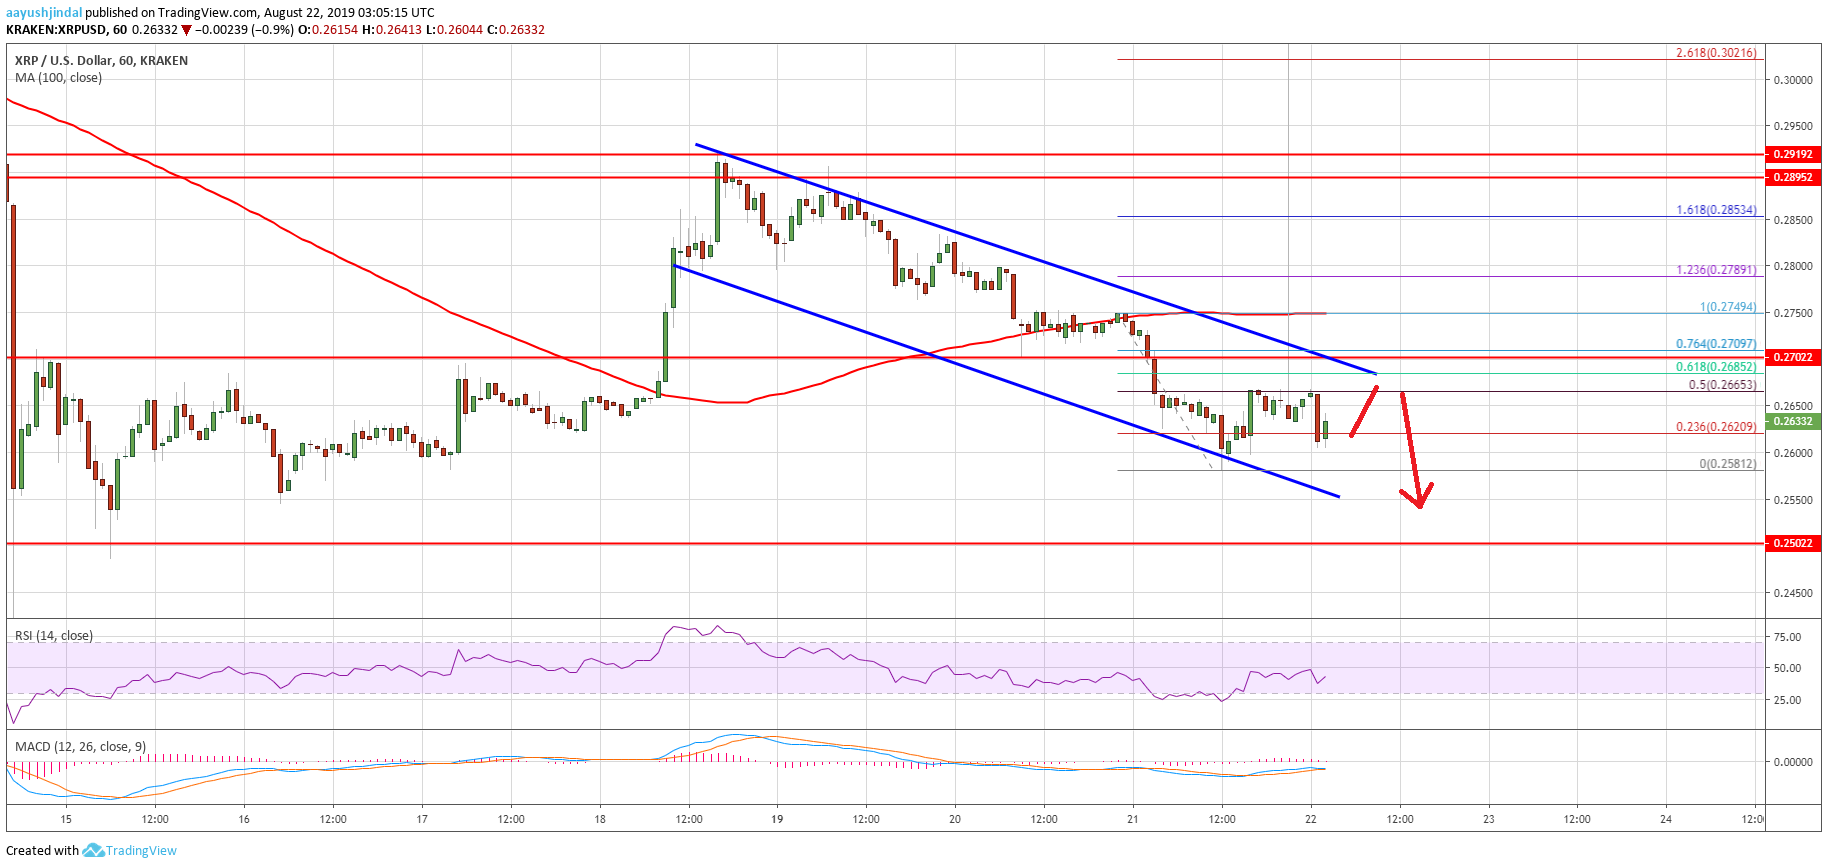
- There is a major declining channel forming with resistance near $0.2680 on the hourly chart of the XRP/USD pair (data source from Kraken).
- The pair might correct a few points, but upsides are likely to remain capped near $0.2680 and $0.2700.
Ripple price is back in a downtrend below $0.2700 against the US Dollar. Bitcoin and Ethereum nosedived recently, putting a lot of pressure on XRP below $0.2650.
Ripple Price Analysis
In the past two days, there was a steady decline in XRP price from the $0.2920 resistance against the US Dollar. The recent decline accelerated after the price broke the key $0.2850 support level. Moreover, the price settled below the $0.2800 level and the 100 hourly simple moving average. It opened the doors for more losses and the price recently declined below the main $0.2700 support.
Ripple price traded as low as $0.2581 recently and it is currently consolidating losses. It traded above the $0.2620 level plus the 23.6% Fib retracement level of the downward move from the $0.2749 high to $0.2581 low. However, the price failed to climb above the $0.2660 level. It seems like there are many hurdles forming near the $0.2660, $0.2680 and $0.2700 levels.
The recent failure was near the 50% Fib retracement level of the downward move from the $0.2749 high to $0.2581 low. Moreover, there is a major declining channel forming with resistance near $0.2680 on the hourly chart of the XRP/USD pair. Above the channel resistance, the next major resistance is near the $0.2700 level. The 100 hourly SMA is also waiting near the $0.2750 level to prevent gains.
On the downside, an immediate support is near the $0.2580 swing low. If there is a downside break below $0.2580, ripple price is likely to revisit the $0.2500 support area. In the mentioned case, there is a risk of more downsides below $0.2500 and the price could trade to a new monthly low.
Looking at the chart, ripple price is clearly trading in a bearish zone below the $0.2700 and $0.2750 resistance levels. Therefore, there are high chances of more downsides below $0.2580 and $0.2500 in the near term. Only a close above $0.2750 might negate the current bearish view.
Technical Indicators
Hourly MACD – The MACD for XRP/USD is likely to move into the bearish zone.
Hourly RSI (Relative Strength Index) – The RSI for XRP/USD is currently well below the 50 level.
Major Support Levels – $0.2580, $0.2500 and $0.2420.
Major Resistance Levels – $0.2680, $0.2700 and $0.2750.