
Reason to trust
How Our News is Made
Strict editorial policy that focuses on accuracy, relevance, and impartiality
Ad discliamer
Morbi pretium leo et nisl aliquam mollis. Quisque arcu lorem, ultricies quis pellentesque nec, ullamcorper eu odio.
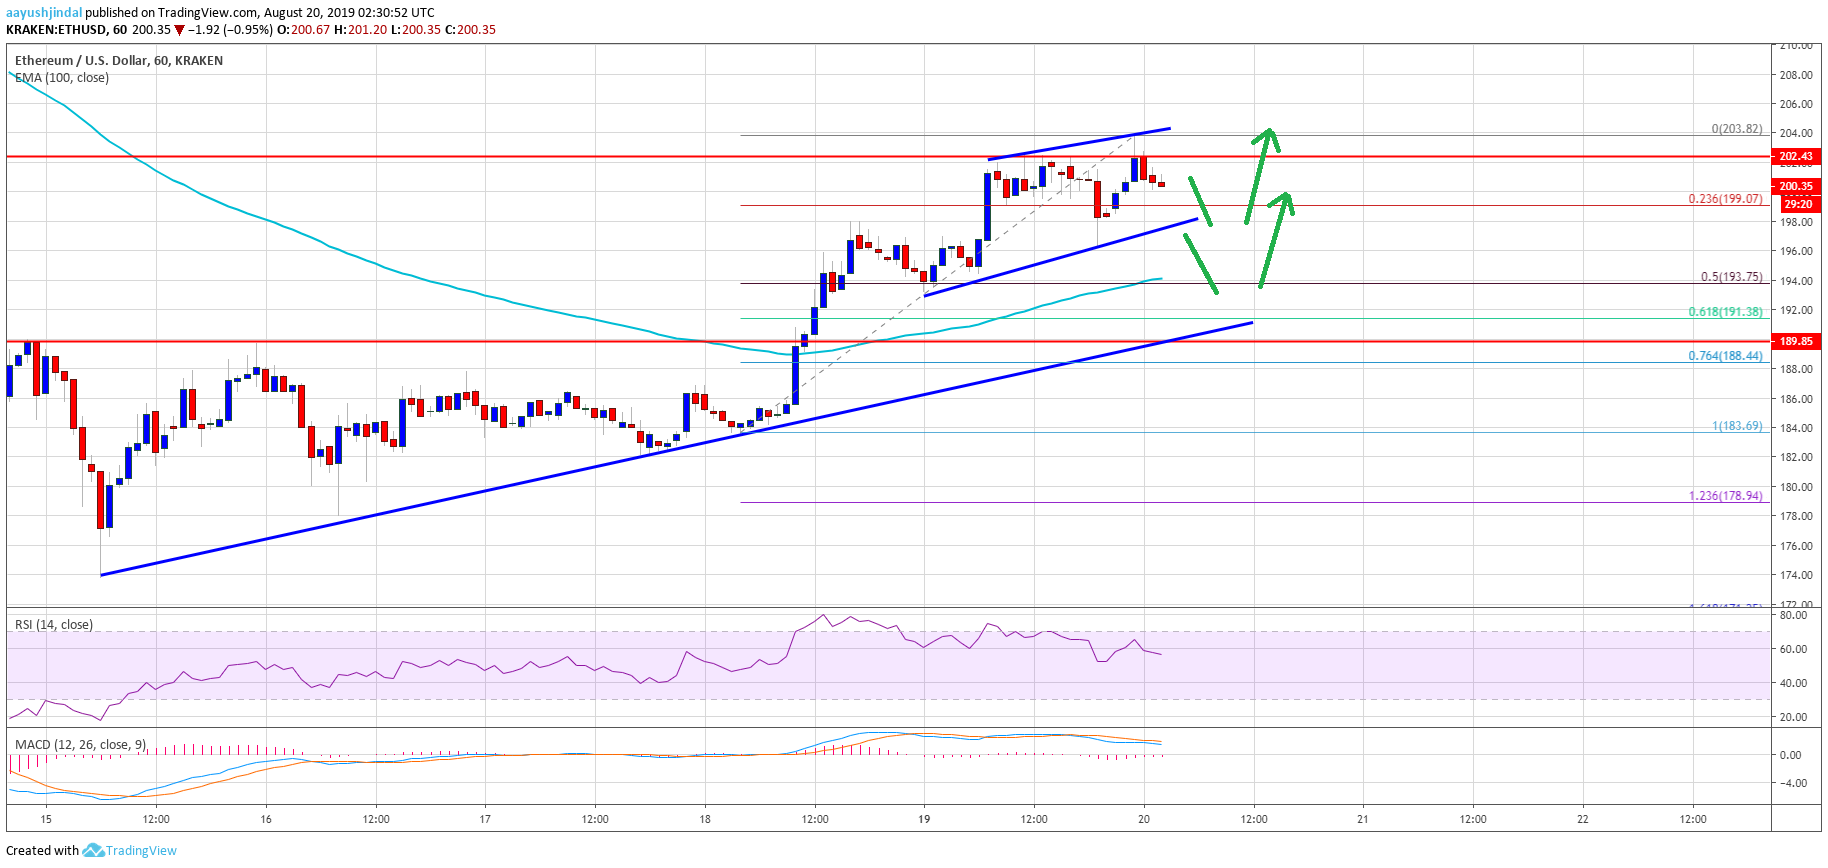
- ETH price extended its recent upward move and tested the $202 resistance against the US Dollar.
- The price is struggling to gain bullish momentum above the $202 resistance area.
- There is a short term ascending channel forming with support near $198 on the hourly chart of ETH/USD (data feed via Kraken).
- The pair could decline a few points, but dips remain supported near $198, $195 and $192.
Ethereum price is showing positive signs above $195 versus the US Dollar, while bitcoin is up 5%. ETH price is likely to accelerate higher once it settles above the $202 resistance area.
Ethereum Price Analysis
Yesterday, there was a decent recovery initiated in ETH price above the $190 resistance against the US Dollar. More importantly, bitcoin price rallied and climbed above the $10,500 and $10,600 resistance levels (as discussed yesterday). It opened the doors for more gains and ETH/USD climbed above the $195 and $198 resistance levels. Moreover, there was a break above the $200 resistance and a close above the 100 hourly simple moving average.
However, Ethereum price seems to be facing a strong resistance near the $202 zone. The price made a few attempts to gain strength above $202, but it failed. At the moment, the price is consolidating near $200, with an immediate support near the $198 level. Moreover, the 23.6% Fib retracement level of the recent wave from the $184 low to $203 swing high might also act as a support.
Additionally, there is a short term ascending channel forming with support near $198 on the hourly chart of ETH/USD. Below the channel support, the next important support is near the $195 level. The 50% Fib retracement level of the recent wave from the $184 low to $203 swing high is also near $194 to act as a support. More importantly, the 100 hourly SMA is at $194 to provide support if Ethereum dips.
Therefore, the price could decline a few points, but dips remain supported near $198, $195 and $192. On the upside, the price must gain momentum above the $202 and $204 levels. A successful close above $205 might pump the price further higher towards the $210 and $215 levels.
Looking at the chart, Ethereum price is facing a major resistance near the $202 zone. If it continues to struggle, there could be a downside correction. Having said that, the bulls are likely to remain active near the $195 and $192 support levels. Only a close below $190 could negate the current bullish view.
ETH Technical Indicators
Hourly MACD – The MACD for ETH/USD is about to move into the bullish zone.
Hourly RSI – The RSI for ETH/USD is currently correcting lower below the 60 level.
Major Support Level – $192
Major Resistance Level – $202


