
Reason to trust
How Our News is Made
Strict editorial policy that focuses on accuracy, relevance, and impartiality
Ad discliamer
Morbi pretium leo et nisl aliquam mollis. Quisque arcu lorem, ultricies quis pellentesque nec, ullamcorper eu odio.
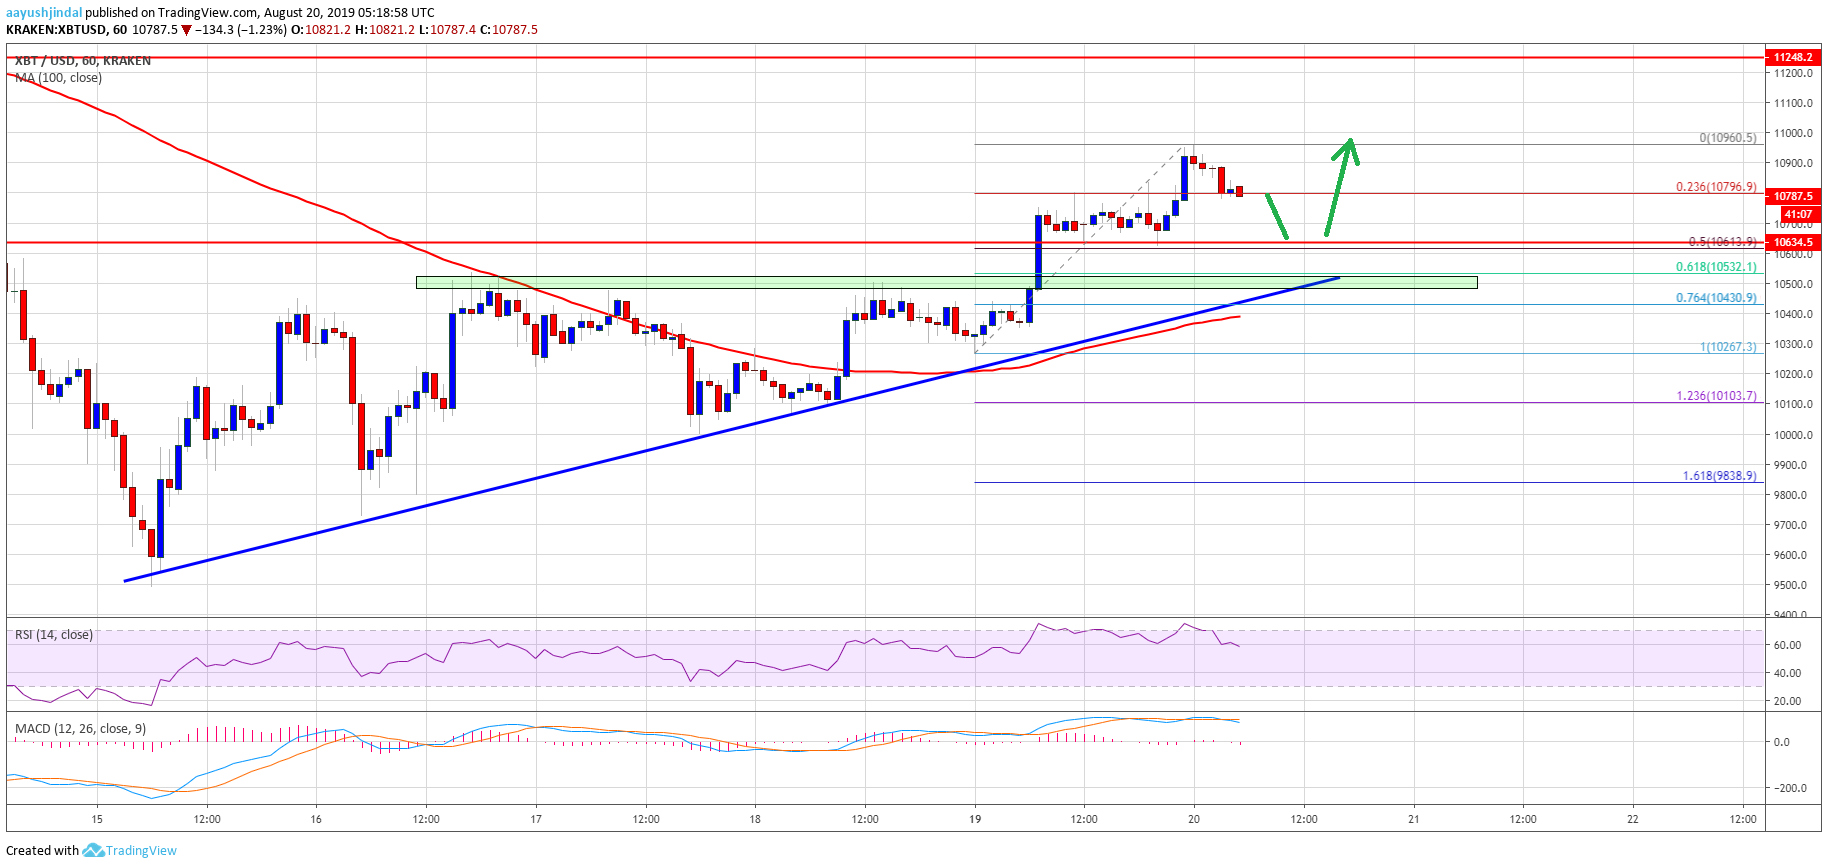
- Bitcoin price extended gains above the key $10,600 and $10,800 resistances against the US Dollar.
- The price is currently correcting lower after trading to a new weekly high at $10.960.
- Yesterday’s highlighted major bullish trend line is intact with support near $10,500 on the hourly chart of the BTC/USD pair (data feed from Kraken).
- The price could correct lower, but it seems like the bulls are eyeing a test of the $11,200 resistance area.
Bitcoin price is gaining bullish momentum above $10,500 against the US Dollar. BTC is likely to climb towards $11,200 or $11,400 as long as it stays above $10,500.
Bitcoin Price Analysis
Yesterday, we discussed the chances of a strong rise in BTC if it breaks $10,600 against the US Dollar. The price did gain bullish momentum above the $10,500 and $10,600 resistance levels. It opened the doors for more gains above the $10,700 level and the 100 hourly simple moving average. Finally, the price surpassed the $10,800 resistance and traded to a new weekly high at $10,960.
Recently, the price started a downside correction below the $10,900 level. Moreover, it traded below the 23.6% Fib retracement level of the recent wave from the $10,267 low to $10,960 high. It seems like there could be an extended downside correction towards the $10,500 support level. An immediate support is near the $10,600 level (the previous resistance). Additionally, the 50% Fib retracement level of the recent wave from the $10,267 low to $10,960 high is near the $10,600 level.
More importantly, yesterday’s highlighted major bullish trend line is intact with support near $10,500 on the hourly chart of the BTC/USD pair. Bitcoin price clearly remains well supported on the downside near the $10,600 and $10,500 support levels. If there is a bearish break and close below $10,500 plus the 100 hourly simple moving average, the price could move back into a bearish zone.
On the upside, an immediate resistance is near the recent high at $10,960, followed by $11,000. If the price continues to rise, the next important resistance is near the $11,200 and $11,250 levels.
Looking at the chart, bitcoin price is trading nicely above the $10,500 support level. As long as there is no daily close below $10,500, there are high chances of more upsides towards $11,200 in the coming sessions. Additionally, if the bulls remain in action, they might be able to push the price towards the $11,400 level.
Technical indicators:
Hourly MACD – The MACD is slowly moving back into the bearish zone.
Hourly RSI (Relative Strength Index) – The RSI for BTC/USD is currently correcting lower towards the 50 level.
Major Support Levels – $10,600 followed by $10,500.
Major Resistance Levels – $10,960, $11,000 and $11,200.


