
Reason to trust
How Our News is Made
Strict editorial policy that focuses on accuracy, relevance, and impartiality
Ad discliamer
Morbi pretium leo et nisl aliquam mollis. Quisque arcu lorem, ultricies quis pellentesque nec, ullamcorper eu odio.
- There was a strong drop in bitcoin price below the $10,500 support against the US Dollar.
- The price is currently correcting losses, but it remains below key hurdles near $10,500.
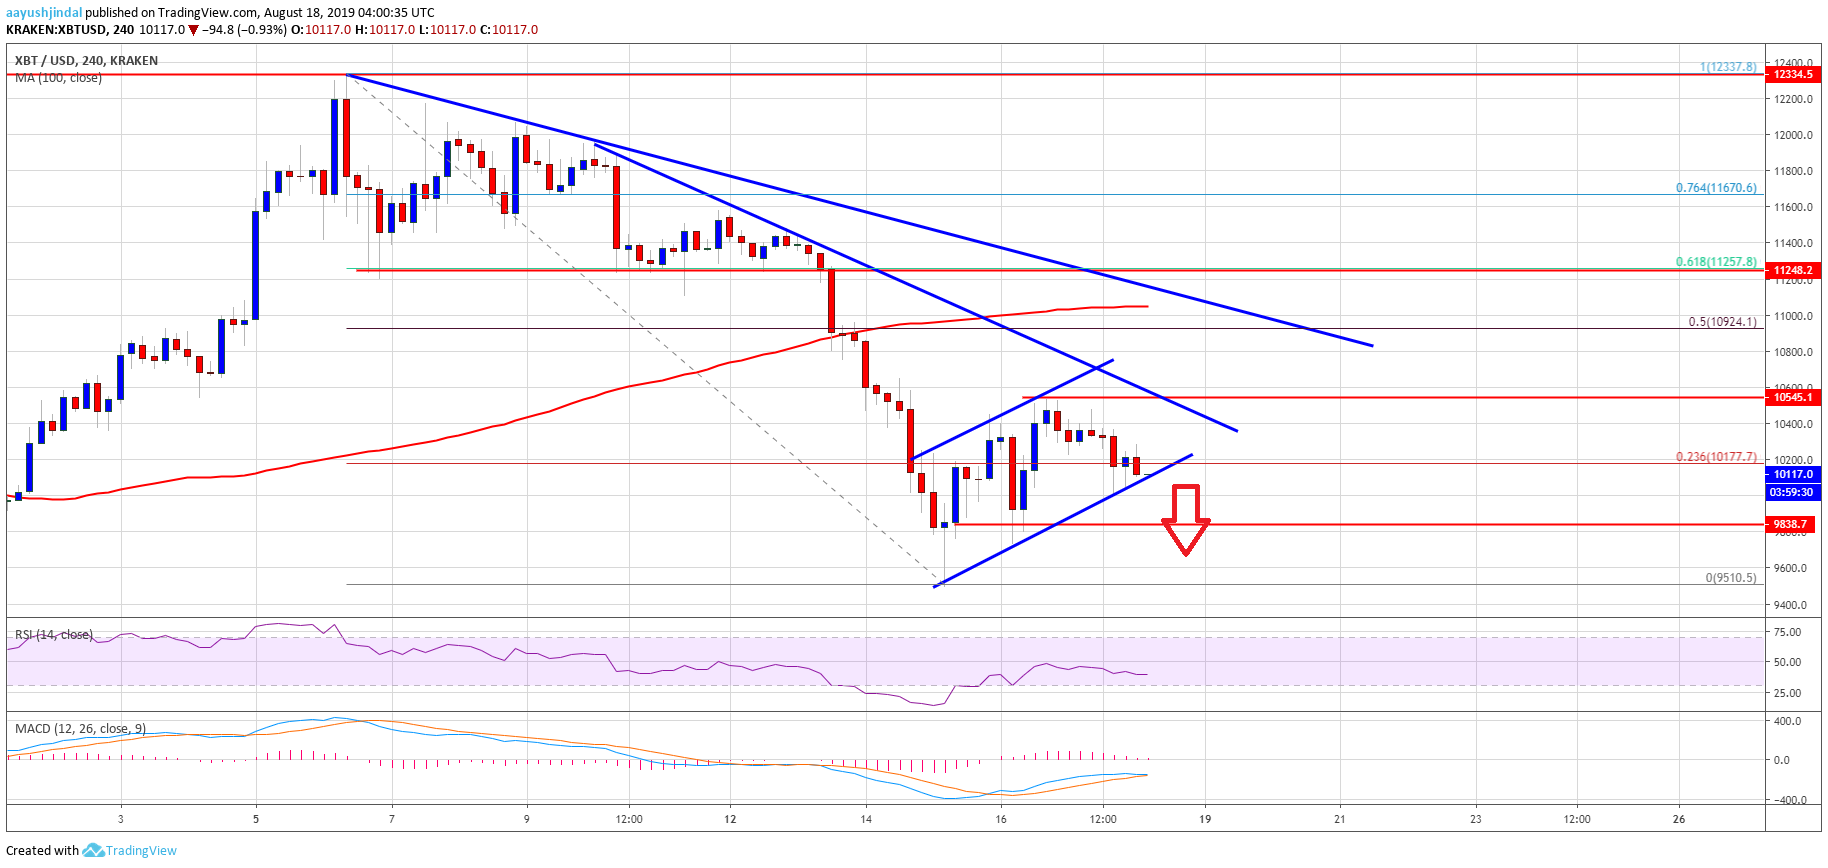
- There is a bearish continuation pattern forming with support near $10,080 on the 4-hours chart of the BTC/USD pair (data feed from Kraken).
- The pair is likely to resume its decline below the $10,000 and $9,800 support levels.
Bitcoin price is trading in a downtrend below $10,500 and $10,800 against the US Dollar. BTC price remains at a risk of more losses below the $9,800 support area.
Bitcoin Price Weekly Analysis (BTC)
In the last weekly forecast, we discussed the chances of a strong decline in bitcoin price to $10,500 against the US Dollar. The BTC/USD pair did decline in the past few days and even broke the $10,500 support level. Moreover, there was a break below $10,000 and a close below the 100 simple moving average (4-hours). The decline was such that the price even traded below $9,800 and a new monthly low was formed near $9,510.
Recently, the price started an upside correction above the $10,000 resistance level. Moreover, there was a break above the 23.6% Fib retracement level of the last major decline from the $12,337 high to $9,510 swing low. However, the previous support near the $10,500 level is acting as a strong resistance. Additionally, there is a bearish continuation pattern forming with support near $10,080 on the 4-hours chart of the BTC/USD pair.
If there is a downside break below the $10,000 support, bitcoin price could resume its decline. An immediate support is near the $9,800 level, below which the price may perhaps revisit the $9,500 support level. Finally, if there are more downsides, the price could test the $9,200 and $9,000 levels.
On the upside, there are many important resistances near $10,500 and $10,800. Moreover, the 50% Fib retracement level of the last major decline from the $12,337 high to $9,510 swing low is near the $10,900 level. There is also a crucial bearish trend line forming with resistance near $10,800s. Therefore, a break above the $10,500 and $10,800 resistance levels won’t be easy in the near term.
Looking at the chart, bitcoin price is clearly trading in a bearish zone below $10,500. Therefore, there is a risk of more downsides below the $10,000 and $9,800 support levels. To start a strong recovery, the price must surpass the $10,500 and $10,800 resistance levels.
Technical indicators
4 hours MACD – The MACD for BTC/USD is about to move back into the bearish zone.
4 hours RSI (Relative Strength Index) – The RSI for BTC/USD is currently declining towards the 25 level.
Major Support Level – $10,000
Major Resistance Level – $10,500