
Reason to trust
How Our News is Made
Strict editorial policy that focuses on accuracy, relevance, and impartiality
Ad discliamer
Morbi pretium leo et nisl aliquam mollis. Quisque arcu lorem, ultricies quis pellentesque nec, ullamcorper eu odio.
- ETH price is struggling to correct higher above the $215 resistance against the US Dollar.
- Ethereum price is still holding the $200 support, while bitcoin declined 6% to trade below $11,000.
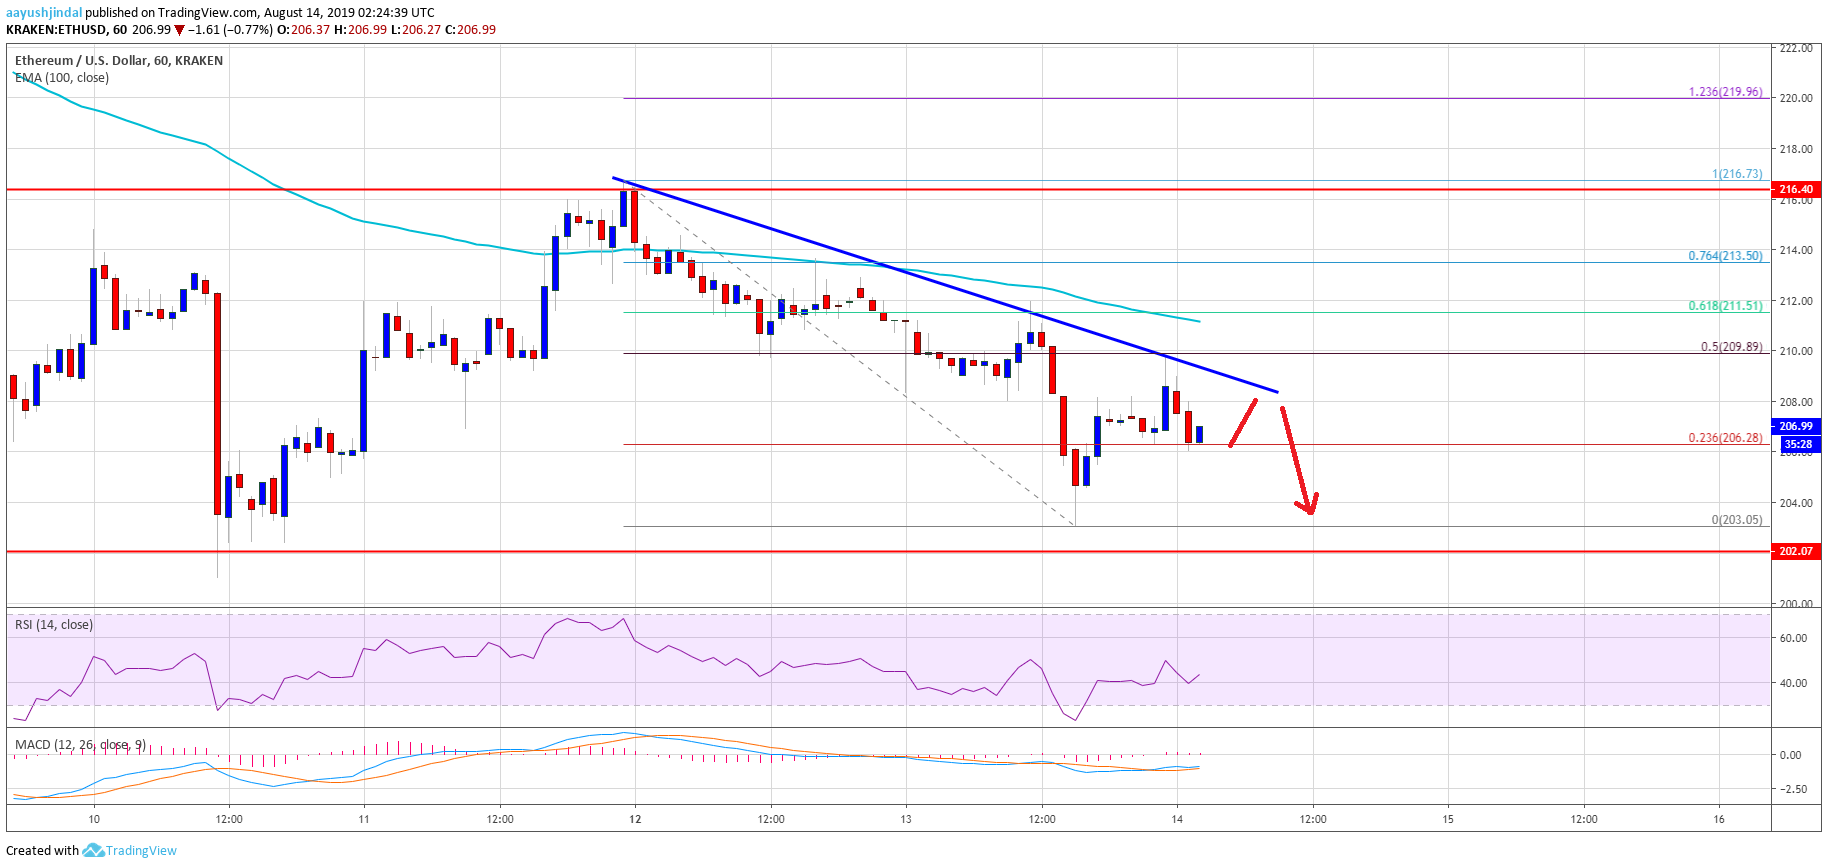
- There is a major bearish trend line forming with resistance near $208 on the hourly chart of ETH/USD (data feed via Kraken).
- The pair remains at a risk of more downsides unless it breaks the $215 and $220 resistance levels.
Ethereum price is holding the key $200 support versus the US Dollar, whereas recovering vs bitcoin. ETH price might continue to struggle as long as it is below $220.
Ethereum Price Analysis
In the past few sessions, there was a steady decline in ETH price from the $216 resistance against the US Dollar. More importantly, bitcoin price gained bearish momentum and declined towards the $10,500 bearish target (as discussed in the weekly forecast). However, Ether’s price remained above the $200 support area and no new weekly low was formed.
The last swing low was formed near $203 and the price is currently correcting higher. It broke the $206 level plus the 23.6% Fib retracement level of the recent decline from the $216 high to $203 low. However, the price is still trading well below the $210 level and the 100 hourly simple moving average. Additionally, there is a major bearish trend line forming with resistance near $208 on the hourly chart of ETH/USD.
The 50% Fib retracement level of the recent decline from the $216 high to $203 low is also acting as a resistance. Therefore, the price remains in a bearish zone below $210. Above the mentioned $210 resistance, the next resistance could be near the $212 level and the 100 hourly SMA. The main resistance on the upside is near the $215 and $216 levels.
On the downside, the $202 and $200 support levels hold the key. If there is a bearish break below the $200 support, the price could slide roughly 5%. The next stop for the bears could be near the $190 or $185 support area.
Looking at the chart, Ethereum price is clearly trading in a bearish zone below $215. However, it is holding the key $200 support area. As long as there is no daily close below the $200 support, there are chances of a short term rebound. Having said that, it won’t be easy for the bulls to gain traction above the $215 and $216 resistance levels.
ETH Technical Indicators
Hourly MACD – The MACD for ETH/USD is slowly moving back into the bearish zone.
Hourly RSI – The RSI for ETH/USD is holding the 40 level, with a minor bullish angle.
Major Support Level – $202
Major Resistance Level – $212


