
Reason to trust
How Our News is Made
Strict editorial policy that focuses on accuracy, relevance, and impartiality
Ad discliamer
Morbi pretium leo et nisl aliquam mollis. Quisque arcu lorem, ultricies quis pellentesque nec, ullamcorper eu odio.
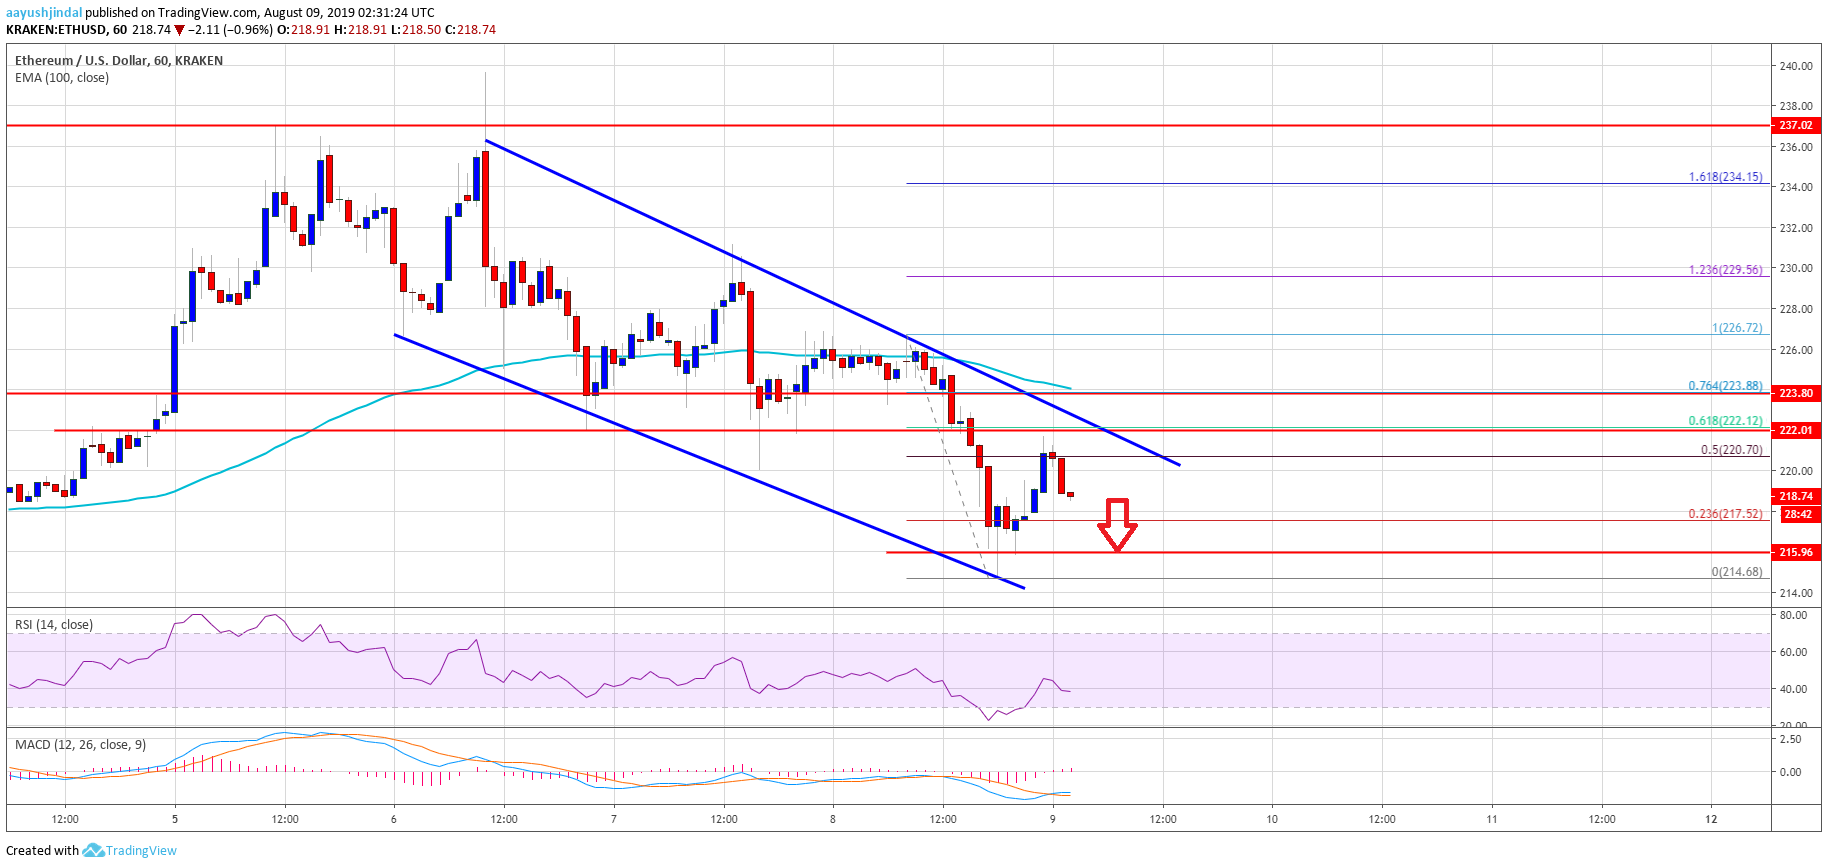
- ETH price struggled to climb higher and declined below the key $224 support against the US Dollar.
- Ethereum price is currently trading in a bearish zone and it even tested the $215 support area.
- There is a major declining channel forming with resistance near $221 on the hourly chart of ETH/USD (data feed via Kraken).
- The pair is likely to face a strong resistance near the $220 and $222 levels in the near term.
Ethereum price is trading with a bearish angle versus the US Dollar and bitcoin. ETH price might continue to decline unless it climbs back above the $222 pivot level.
Ethereum Price Analysis
In the past two days, ETH price faced an increase in selling interest from $230 against the US Dollar. There was a steady decline below the $225 support level. Moreover, Ethereum price even broke the key $222 support level and settled below the 100 hourly simple moving average. On the other hand, bitcoin price mostly traded with a positive bias, but it seems to be struggling near the $12,000 resistance.
The recent decline in Ether’s price was such that the price even broke the $220 support. A new weekly swing low was formed near $214 and the price is currently correcting higher. It traded above the $218 level plus the 23.6% Fib retracement level of the recent drop from the $226 high to $214 swing low. However, the upward move was capped by the previous support at $220.
Moreover, Ethereum price failed to surpass the 50% Fib retracement level of the recent drop from the $226 high to $214 swing low. More importantly, there is a major declining channel forming with resistance near $221 on the hourly chart of ETH/USD. Therefore, the pair is facing a strong resistance near the $220, $221 and $222 levels. To start a fresh increase, the price has to surpass the $222 resistance.
On the downside, an initial support is near the $215 level. If there is a downside break below the $215 support, the price could accelerate towards the $210 support. The next major support is near the $202 level, where the bulls may take a stand.
Looking at the chart, Ethereum price is facing an uphill task near the $220 and $222 resistance levels. Moreover, bitcoin’s resilience is putting a lot of pressure on ETH below $230. Therefore, the bulls need to gain strength above $222 to revisit the key $230 resistance.
ETH Technical Indicators
Hourly MACD – The MACD for ETH/USD is slowly climbing into the bullish zone.
Hourly RSI – The RSI for ETH/USD is moving lower towards the 30 level.
Major Support Level – $215
Major Resistance Level – $222


