
Reason to trust
How Our News is Made
Strict editorial policy that focuses on accuracy, relevance, and impartiality
Ad discliamer
Morbi pretium leo et nisl aliquam mollis. Quisque arcu lorem, ultricies quis pellentesque nec, ullamcorper eu odio.
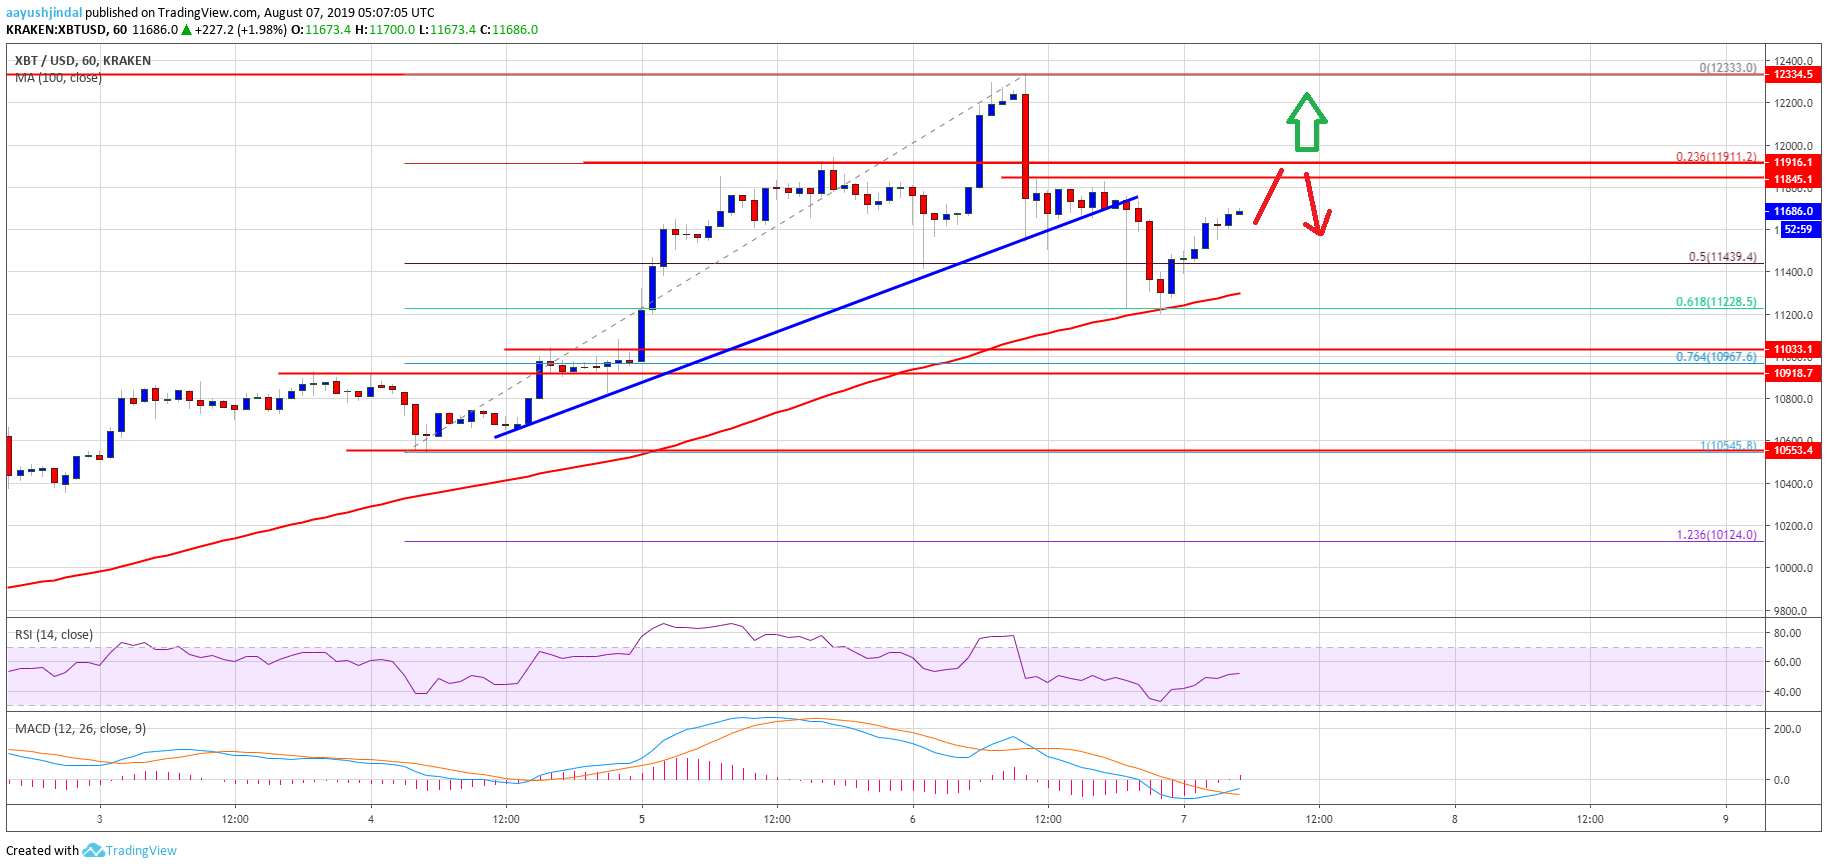
- Bitcoin price traded to a new monthly high at $12,333 and corrected lower sharply against the US Dollar.
- The price is currently climbing higher after it tested the key $11,200 support area.
- Yesterday’s highlighted key bullish trend line was breached with support near $11,700 on the hourly chart of the BTC/USD pair (data feed from Kraken).
- The price could revisit the $12,000 resistance, which is now a major breakout zone.
Bitcoin price is recovering from $11,200 against the US Dollar. However, BTC price must break the $12,000 resistance to continue higher in the coming sessions.
Bitcoin Price Analysis (BTC/USD)
Yesterday, there was a sharp rally in bitcoin price above the $12,000 resistance against the US Dollar. The BTC/USD pair even traded above the second bullish target of $12,200 (as discussed in one of the previous analysis). The pair traded to a new monthly high at $12,333 and corrected lower sharply. It traded below the $12,000 and $11,800 support levels. Furthermore, there was a break below the key $11,500 support area.
The price even traded below the 50% Fib retracement level of the recent rally from the $10,545 low to $12,333 high. More importantly, yesterday’s highlighted key bullish trend line was breached with support near $11,700 on the hourly chart of the BTC/USD pair. The pair tested the next key support near the $11,200 level and the 100 hourly simple moving average.
Moreover, the 61.8% Fib retracement level of the recent rally from the $10,545 low to $12,333 high acted as a decent support area. Bitcoin price formed a base above the $11,200 level and it is currently correcting higher. It is trading above the $11,500 level, with a bullish angle. However, there is a major resistance forming near the $11,850 and $12,000 levels.
Therefore, a successful break above the $12,000 level is needed for a fresh rally. The next key resistances are near $12,200 and $12,350. Conversely, if the price fails to surpass the $11,850 and $12,000 levels, there could be another decline. An immediate support is near the $11,500 level. The main support is near the $11,200 level and the 100 hourly SMA.
Looking at the chart, bitcoin price is clearly facing an uphill task near the $11,850 and $12,000 resistance levels. Having said that, the price is likely to gain bullish momentum as long as it is trading above the $11,200 support and the 100 hourly SMA
Technical indicators:
Hourly MACD – The MACD is slowly moving back into the bullish zone.
Hourly RSI (Relative Strength Index) – The RSI for BTC/USD is currently near the 50 level, with a minor bearish angle.
Major Support Levels – $11,500 followed by $11,200.
Major Resistance Levels – $11,850, $12,000 and $12,200.


