
Reason to trust
How Our News is Made
Strict editorial policy that focuses on accuracy, relevance, and impartiality
Ad discliamer
Morbi pretium leo et nisl aliquam mollis. Quisque arcu lorem, ultricies quis pellentesque nec, ullamcorper eu odio.
- ETH price extended gains above the $230 resistance and climbed above $235 against the US Dollar.
- The price tested the $237 level and it is currently correcting gains.
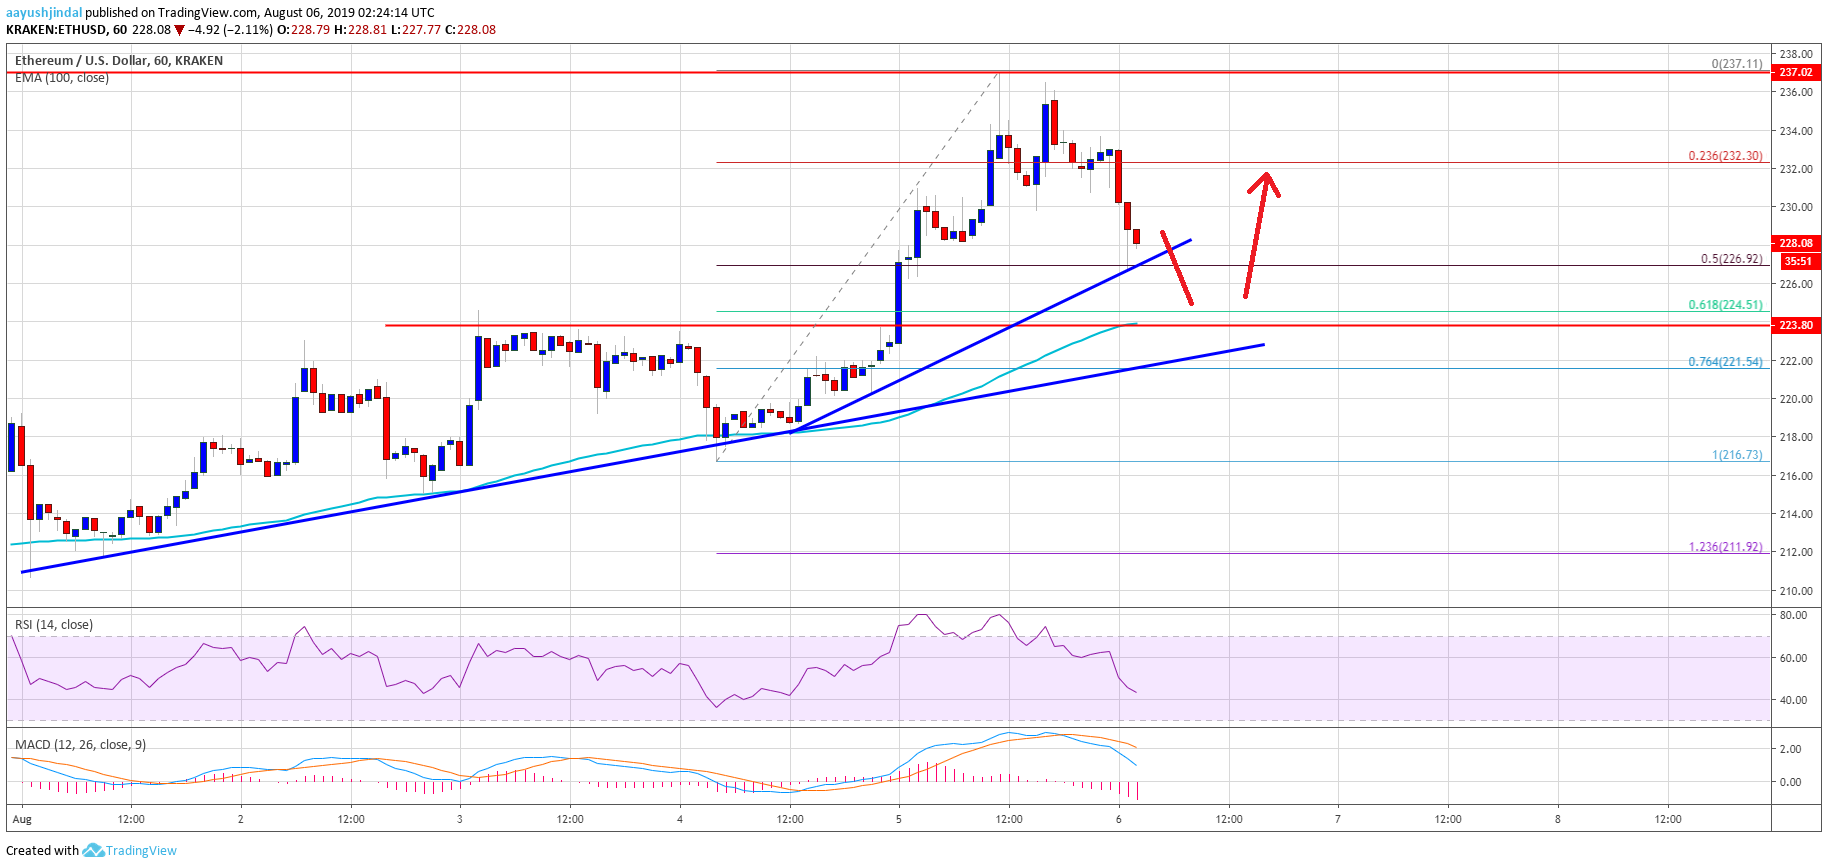
- There are two bullish trend lines forming with support near $226 and $222 on the hourly chart of ETH/USD (data feed via Kraken).
- The pair could find a strong buying interest near the $224 and $225 support levels in the near term.
Ethereum price is correcting gains from $237 versus the US Dollar, and bitcoin is holding $11,500. ETH price could test the main $224 support in the near term, where the bulls might take a stand.
Ethereum Price Analysis
Yesterday, we saw a nice upward move in bitcoin and Ethereum price above $11,500 and $220 respectively against the US Dollar. The ETH/USD pair extended gains above the $230 resistance and traded to a new weekly high. Moreover, there was a break above the $235 level and a swing high was formed near $237. Recently, the price started a downside correction below $235, but it remains well above the 100 hourly simple moving average.
It traded below the 23.6% Fib retracement level of the recent wave from the $216 low to $237 high. Moreover, there was a break below the $230 level. However, the $227 level is currently holding the decline. It represents the 50% Fib retracement level of the recent wave from the $216 low to $237 high. More importantly, there are two bullish trend lines forming with support near $226 and $222 on the hourly chart of ETH/USD.
If there is a downside break below the first trend line, the price could revisit the main $224 and $225 support levels. The 100 hourly SMA is also near the $224 support to act as a strong buy zone. Therefore, dips towards the $224 level remains well supported. Only a downside break below the second trend line and $220 might start a fresh bearish wave.
On the upside, an initial resistance is near the $232 level. A successful close above the $232 level might start a decent upward move in the coming sessions. The next key resistances are near $238 and $240.
Looking at the chart, Ethereum price is clearly correcting gains from the $237 swing high. However, the price is likely to find a strong buying interest near the $224 and $225 support levels. On the upside, the bulls may target the $250 level in the coming days.
ETH Technical Indicators
Hourly MACD – The MACD for ETH/USD is gaining pace in the bearish zone.
Hourly RSI – The RSI for ETH/USD is currently below the 50 level, with a bearish angle.
Major Support Level – $224
Major Resistance Level – $232