
Reason to trust
How Our News is Made
Strict editorial policy that focuses on accuracy, relevance, and impartiality
Ad discliamer
Morbi pretium leo et nisl aliquam mollis. Quisque arcu lorem, ultricies quis pellentesque nec, ullamcorper eu odio.
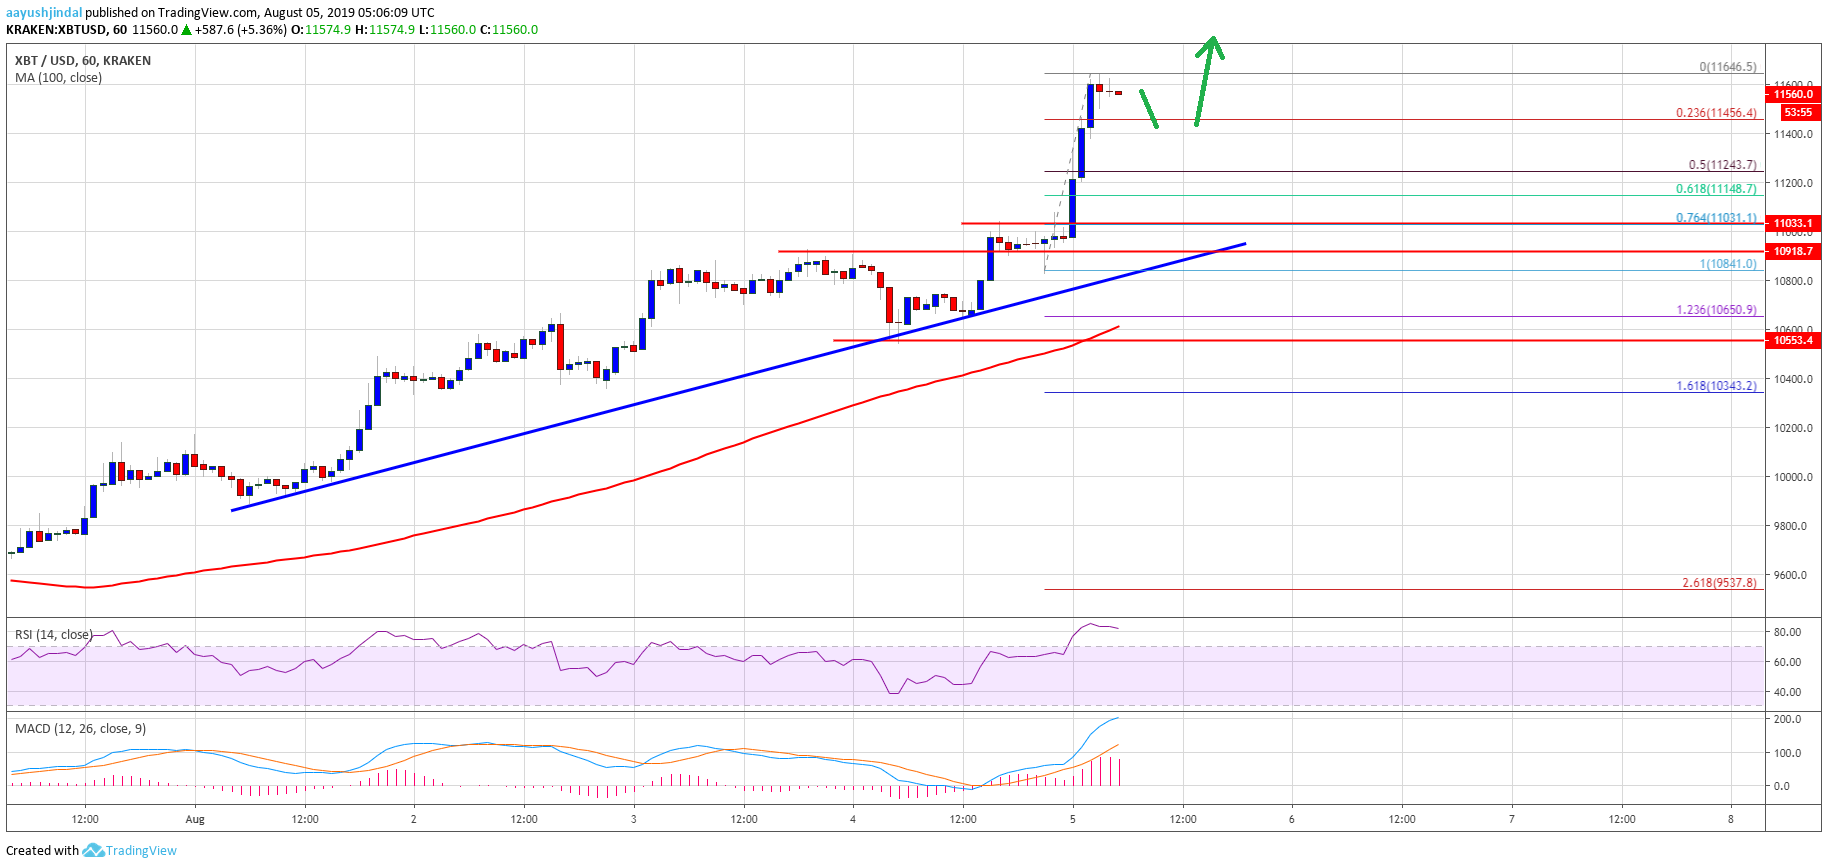
- Bitcoin price rallied more than 8% and climbed towards $11,500 against the US Dollar.
- The price traded as high as $11,646 and it is currently correcting gains.
- There is a key bullish trend line forming with support near $10,900 on the hourly chart of the BTC/USD pair (data feed from Kraken).
- The price is trading with a positive bias and dips remain well supported near $11,500 and $11,200.
There were solid gains in bitcoin price above $11,000 against the US Dollar. BTC price is up more than 8%, broke the $11,200 hurdle, and it tested the $11,500 resistance area.
Bitcoin Price Analysis
In the past two days, there was a steady rise above $10,500 in bitcoin price above $10,000 against the US Dollar. The BTC/USD pair settled above the $11,000 resistance and the 100 hourly simple moving average to move into a positive zone. Moreover, the price broke the $11,200 resistance and tested the $11,500 resistance (as discussed in the weekly forecast). The recent rise was strong as the price traded to a new weekly high at $11,646.
At the outset, the price is consolidating gains near the $11,500 level. An immediate support is near the $11,500 and $11,450 levels. Moreover, the 23% Fib retracement level of the recent rally from the $10,841 low to $11,646 high is also near the $11,450 level to act as a strong support. If there is an extended downside correction, the next support for the bulls could be near the $11,200 level.
Additionally, the 50% Fib retracement level of the recent rally from the $10,841 low to $11,646 high could also provide support near the $11,250 level. The main support zone is near the $11,000 level, which was a resistance earlier and now it could provide support. More importantly, there is a key bullish trend line forming with support near $10,900 on the hourly chart of the BTC/USD pair.
Therefore, if there is a downside correction, the price might find strong bids near $11,250 or $11,000. On the upside, an immediate resistance is near the $11,650 swing high. A successful break above $11,650 might open the doors for a move towards the $12,000 level.
Looking at the chart, bitcoin price is showing a lot of positive signs above the $11,200 and $11,500 levels. The price action suggests that there could be a short term downside correction before more gains above the $11,650 level.
Technical indicators:
Hourly MACD – The MACD is placed heavily in the bullish zone.
Hourly RSI (Relative Strength Index) – The RSI for BTC/USD is currently correcting lower from the overbought zone.
Major Support Levels – $11,450 followed by $11,200.
Major Resistance Levels – $11,650, $11,800 and $12,000.