Reason to trust
How Our News is Made
Strict editorial policy that focuses on accuracy, relevance, and impartiality
Ad discliamer
Morbi pretium leo et nisl aliquam mollis. Quisque arcu lorem, ultricies quis pellentesque nec, ullamcorper eu odio.
- Ripple price is holding the $0.3140 support area, but struggling to gain traction against the US dollar.
- The price is facing a strong resistance near the $0.3200 and $0.3220 levels.
- There is a key bullish trend line forming with support near $0.3140 on the hourly chart of the XRP/USD pair (data source from Kraken).
- The price is likely to climb higher steadily as long as there is no bearish break below $0.3140 and $0.3120.
Ripple price is struggling to rise steadily against the US Dollar, while bitcoin climbed 4%. XRP price might start a decent increase if it breaks the $0.3180 and $0.3200 resistances.
Ripple Price Analysis
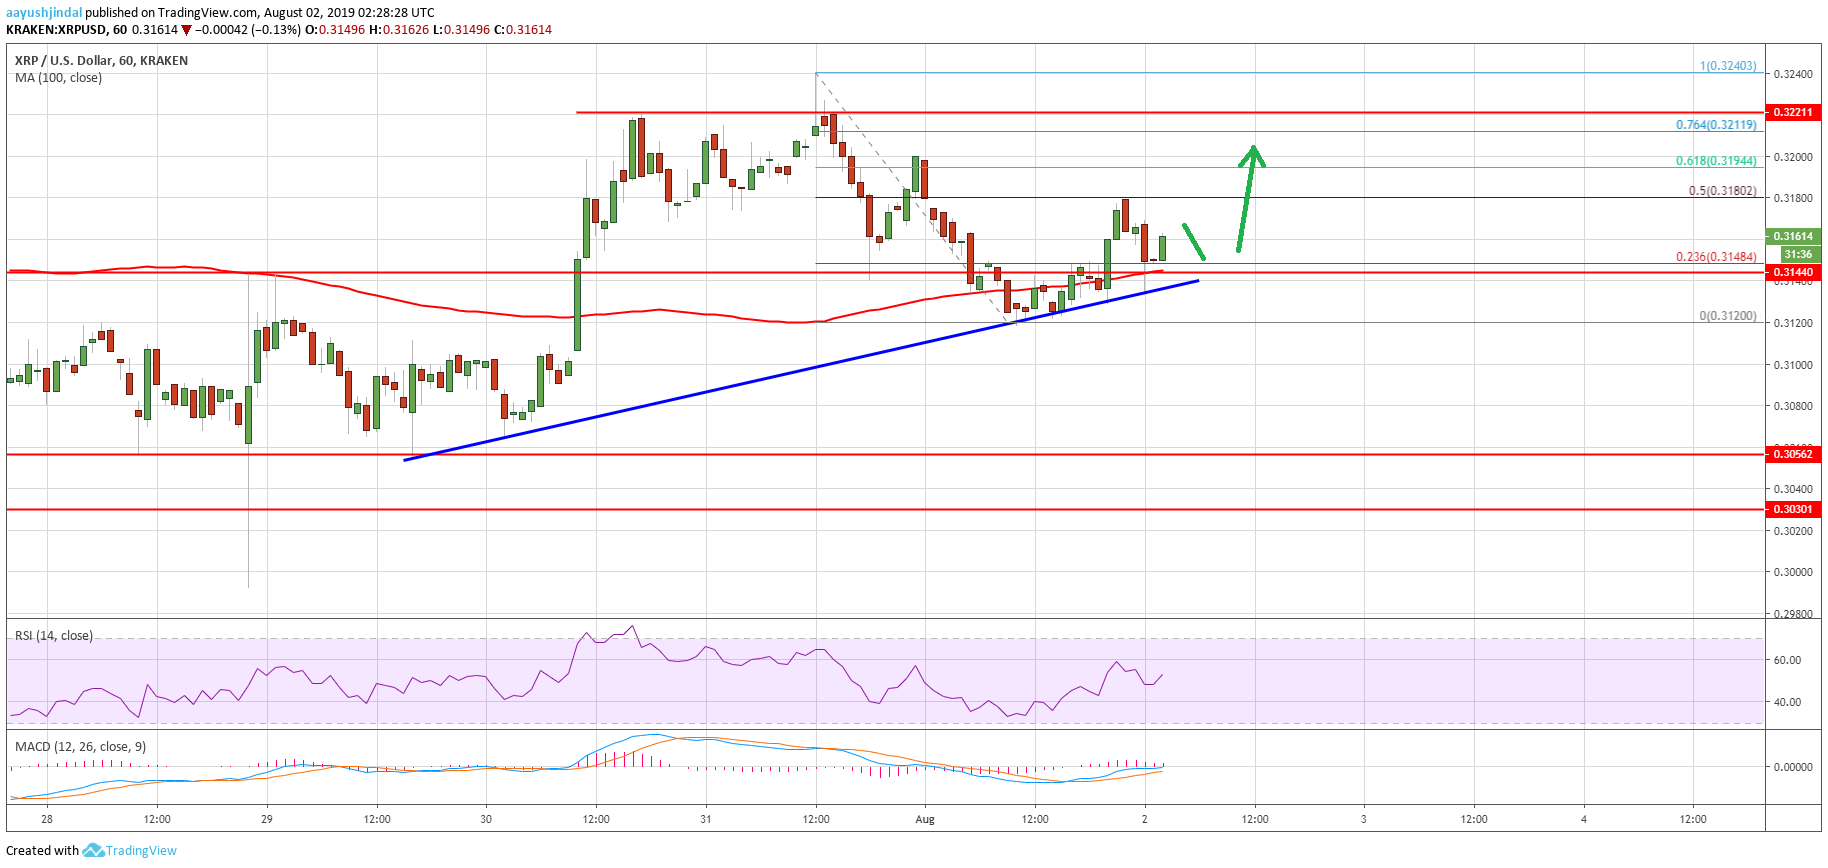
After trading as high as $0.3240, ripple price started a downside correction against the US Dollar. Ethereum price is also trading in a range, while bitcoin price is up around 4% and broke the key $10,200 resistance. The XRP/USD pair corrected below the $0.3180 and $0.3160 levels. It even traded below the $0.3140 support and the 100 hourly simple moving average. However, the $0.3120 support prevented additional losses and the price recovered recently.
The price traded above the $0.3140 and $0.3150 levels. Moreover, there was a break above the 23.6% Fib retracement level of the recent decline from the $0.3240 high to $0.3120 low. The recent recovery seems to be facing resistance near the $0.3180 level. Additionally, the 50% Fib retracement level of the recent decline from the $0.3240 high to $0.3120 low is acting as a resistance.
Therefore, a break above the $0.3180 level might open the doors for more gains. The main resistances on the upside are near $0.3200 and $0.3220. A clear break above $0.3220 might set the pace for more upsides towards the $0.3300 and $0.3320 levels. On the downside, there is a key bullish trend line forming with support near $0.3140 on the hourly chart of the XRP/USD pair.
Therefore, a downside break below the trend line support might start a fresh decline below $0.3140. The next key support is at $0.3120, below which there is a risk of heavy losses in the near term.
Looking at the chart, ripple price is clearly trading above a couple of important supports near $0.3140 and $0.3120. As long as there is no downside break, there are chances of a slow and steady rise above $0.3180. Having said that, a close above $0.3220 is must for uptrend continuation.
Technical Indicators
Hourly MACD – The MACD for XRP/USD is currently reducing its bullish slope.
Hourly RSI (Relative Strength Index) – The RSI for XRP/USD is currently just above the 50 level and is moving higher.
Major Support Levels – $0.3150, $0.3140 and $0.3120.
Major Resistance Levels – $0.3200, $0.3220 and $0.3240.