
Reason to trust
How Our News is Made
Strict editorial policy that focuses on accuracy, relevance, and impartiality
Ad discliamer
Morbi pretium leo et nisl aliquam mollis. Quisque arcu lorem, ultricies quis pellentesque nec, ullamcorper eu odio.
- Bitcoin price traded higher and broke the key $10,200 resistance area against the US Dollar.
- The price is placed nicely above the $10,200 level and it recently tested the $10,500 area.
- There is a major bullish trend line forming with support near $10,200 on the hourly chart of the BTC/USD pair (data feed from Kraken).
- The price remains in an uptrend and it may soon accelerate above the $10,500 resistance level.
There were decent gains in bitcoin price above $10,200 against the US Dollar. BTC price is likely preparing for more gains above the $10,500 and $10,600 levels.
Bitcoin Price Analysis
In the past few sessions, there were positive moves in bitcoin price above $10,000 against the US Dollar. The BTC/USD pair broke the main $10,200 resistance level to move further into the bullish zone. Moreover, there was a close above the $10,200 resistance and the 100 hourly simple moving average. It opened the doors for more gains above the $10,400 level and the price tested the $10,500 resistance level.
A swing high was formed near $10,491 and the price is currently consolidating gains. An immediate support is near the $10,350 level, plus the 23% Fib retracement level of the recent upward move from the $9,881 low to $10,491 high. Moreover, there is a short term declining channel or bullish flag forming with resistance near $10,400 on the hourly chart of the BTC/USD pair.
If there is an upside break, the price is likely to accelerate above $10,450 and $10,500. The next key resistance is near the $10,600 level. On the downside, there is a strong support forming near the $10,200 level. Moreover, there is a major bullish trend line forming with support near $10,200 on the same chart. Finally, the 50% Fib retracement level of the recent upward move from the $9,881 low to $10,491 high is near the $10,180 level.
Therefore, a downside correction towards the $10,200 level is likely to find strong buying interest in the near term. If there is a downside break below the $10,200 support, the price could revisit the $10,000 support area.
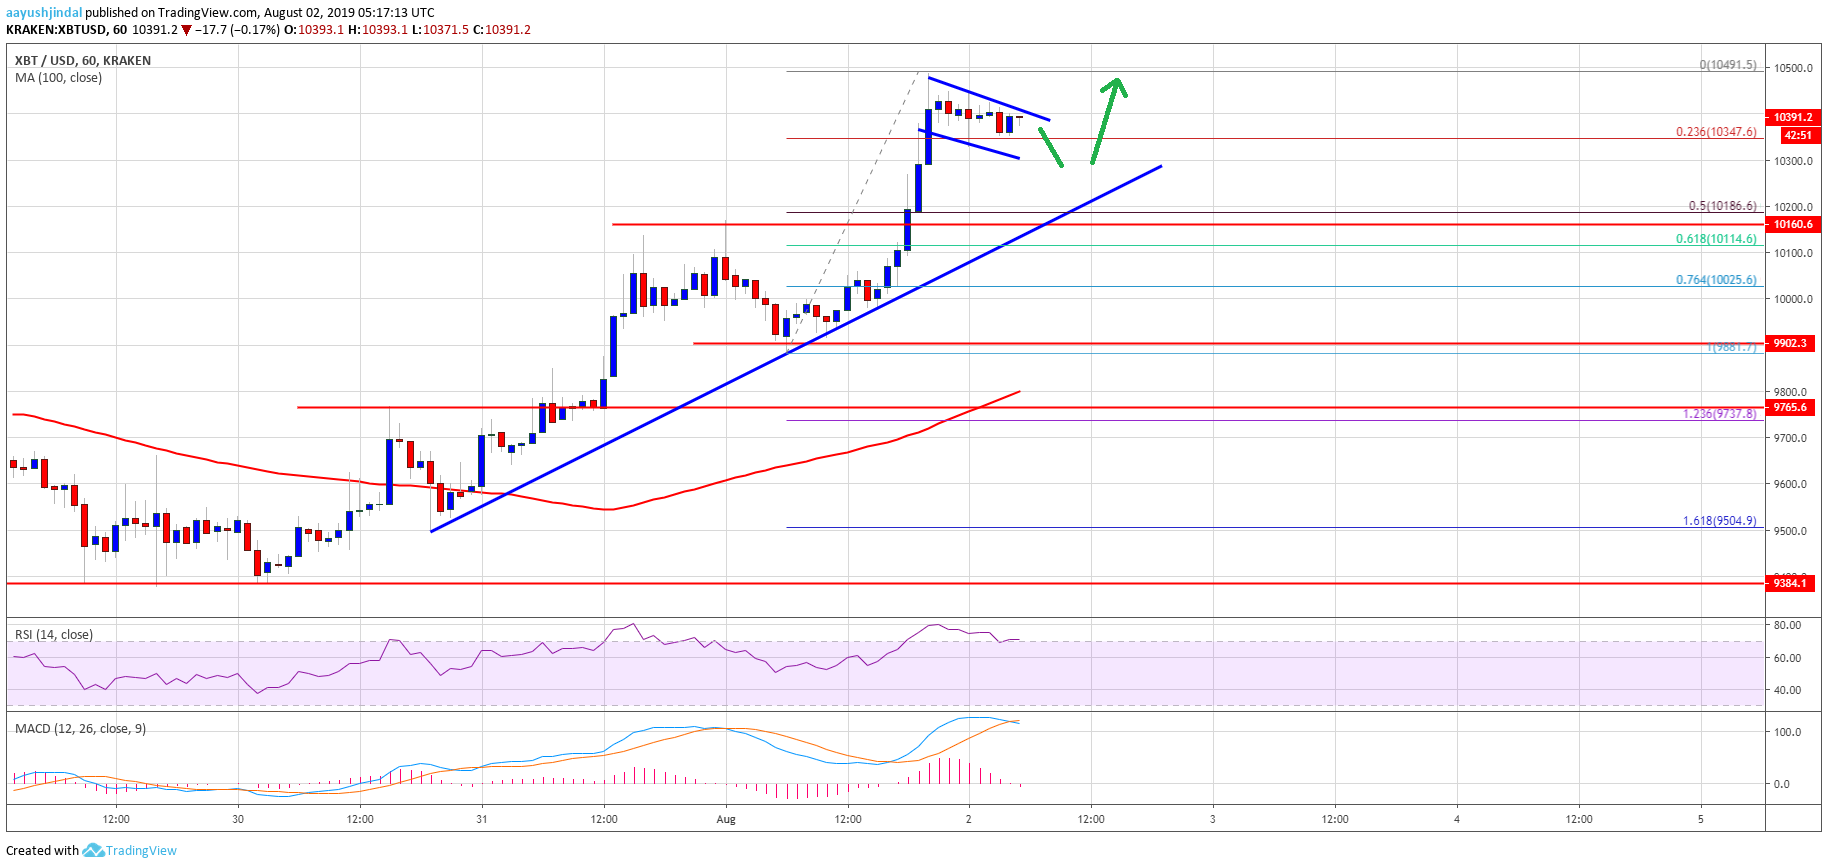
Looking at the chart, bitcoin price is trading with a bullish bias above the $10,000 and $10,200 support levels. Therefore, there are high chances of more gains above the $10,500 and $10,600 levels in the coming sessions. Only a close below $10,000 might push the price back in a bearish zone.
Technical indicators:
Hourly MACD – The MACD is slowly losing momentum in the bullish zone.
Hourly RSI (Relative Strength Index) – The RSI for BTC/USD is currently correcting lower towards the 55 level.
Major Support Levels – $10,200 followed by $10,000.
Major Resistance Levels – $10,400, $10,500 and $10,600.