Reason to trust
How Our News is Made
Strict editorial policy that focuses on accuracy, relevance, and impartiality
Ad discliamer
Morbi pretium leo et nisl aliquam mollis. Quisque arcu lorem, ultricies quis pellentesque nec, ullamcorper eu odio.
- Ripple price is forming a solid support above the $0.3050 level against the US dollar.
- The price is currently climbing higher and it recently tested the $0.3220 resistance area.
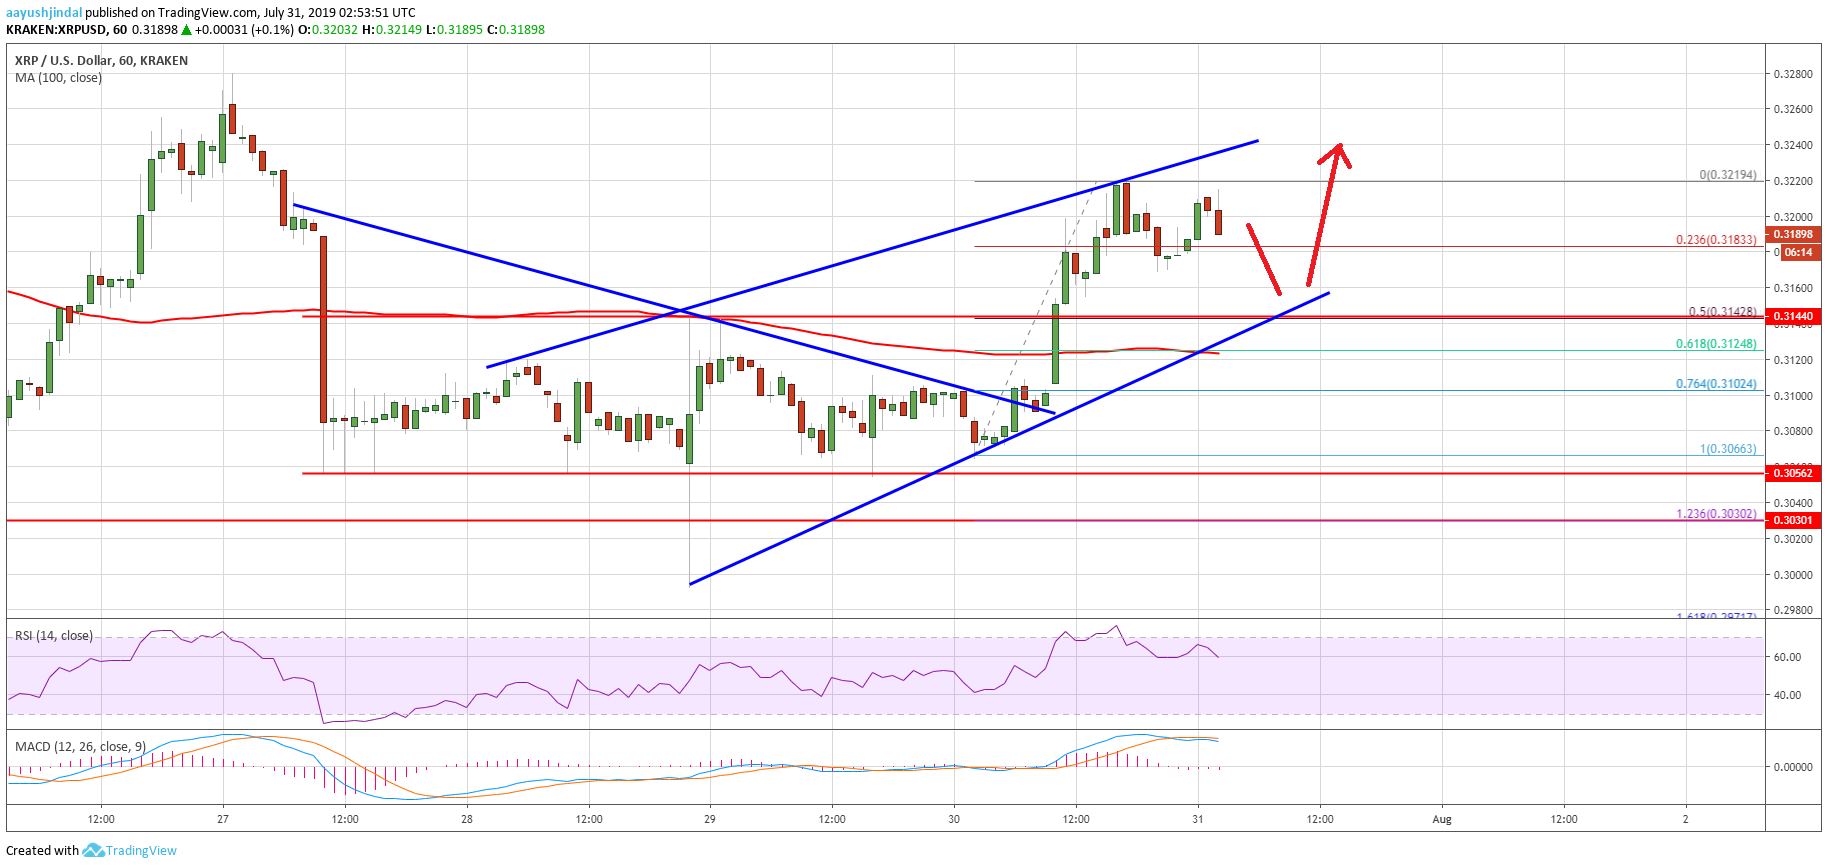
- There is a connecting bullish trend line forming with support near $0.3140 on the hourly chart of the XRP/USD pair (data source from Kraken).
- The price remains well supported on dips above $0.3100 and it could continue to rise above $0.3200.
Ripple price is showing positive signs above $0.3140 against the US Dollar, and bitcoin gained around 3%. XRP price might continue to rise if it clears the $0.3220 resistance.
Ripple Price Analysis
After forming a support base, there was a decent recovery in bitcoin, Ethereum and ripple against the US Dollar. The XRP/USD pair remained well bid above the $0.3050 level and it recently climbed higher. There was a break above the $0.3080 and $0.3100 resistance levels. Moreover, the price managed to climb above yesterday’s drawn connecting bearish trend line on the hourly chart.
Finally, the price broke the key $0.3140 resistance and the 100 hourly simple moving average. It even broke the $0.3200 resistance and tested the $0.3220 resistance. A swing high was formed near $0.3219 and the price is currently correcting gains. It tested the 23.6% Fib retracement level of the recent wave from the $0.3066 low to $0.3219 high.
On the downside, there are many supports forming near the $0.3150 and $0.3140 levels. Additionally, there is a connecting bullish trend line forming with support near $0.3140 on the hourly chart of the XRP/USD pair. The 50% Fib retracement level of the recent wave from the $0.3066 low to $0.3219 high is also near the $0.3142 level to act as a strong support.
Therefore, any dip towards the $0.3150 and $0.3140 levels is likely to find strong bids. If there is a downside break below the $0.3140 level, the price might move back in a bearish zone. On the upside, the resistances are near $0.3200 and $0.3220. A successful close above the $0.3220 resistance could start a decent upward move in the coming sessions towards the $0.3320 and $0.3350 levels.
Looking at the chart, ripple price is trading with a positive bias above the $0.3140 support level. The overall price action is positive and suggests more gains above the $0.3220 level. Only a close below the $0.3140 support and the 100 hourly SMA might negate the current bullish view.
Technical Indicators
Hourly MACD – The MACD for XRP/USD is slowly moving back into the bearish zone.
Hourly RSI (Relative Strength Index) – The RSI for XRP/USD is currently correcting lower towards the 50 level.
Major Support Levels – $0.3150, $0.3140 and $0.3120.
Major Resistance Levels – $0.3200, $0.3220 and $0.3320.