
Reason to trust
How Our News is Made
Strict editorial policy that focuses on accuracy, relevance, and impartiality
Ad discliamer
Morbi pretium leo et nisl aliquam mollis. Quisque arcu lorem, ultricies quis pellentesque nec, ullamcorper eu odio.
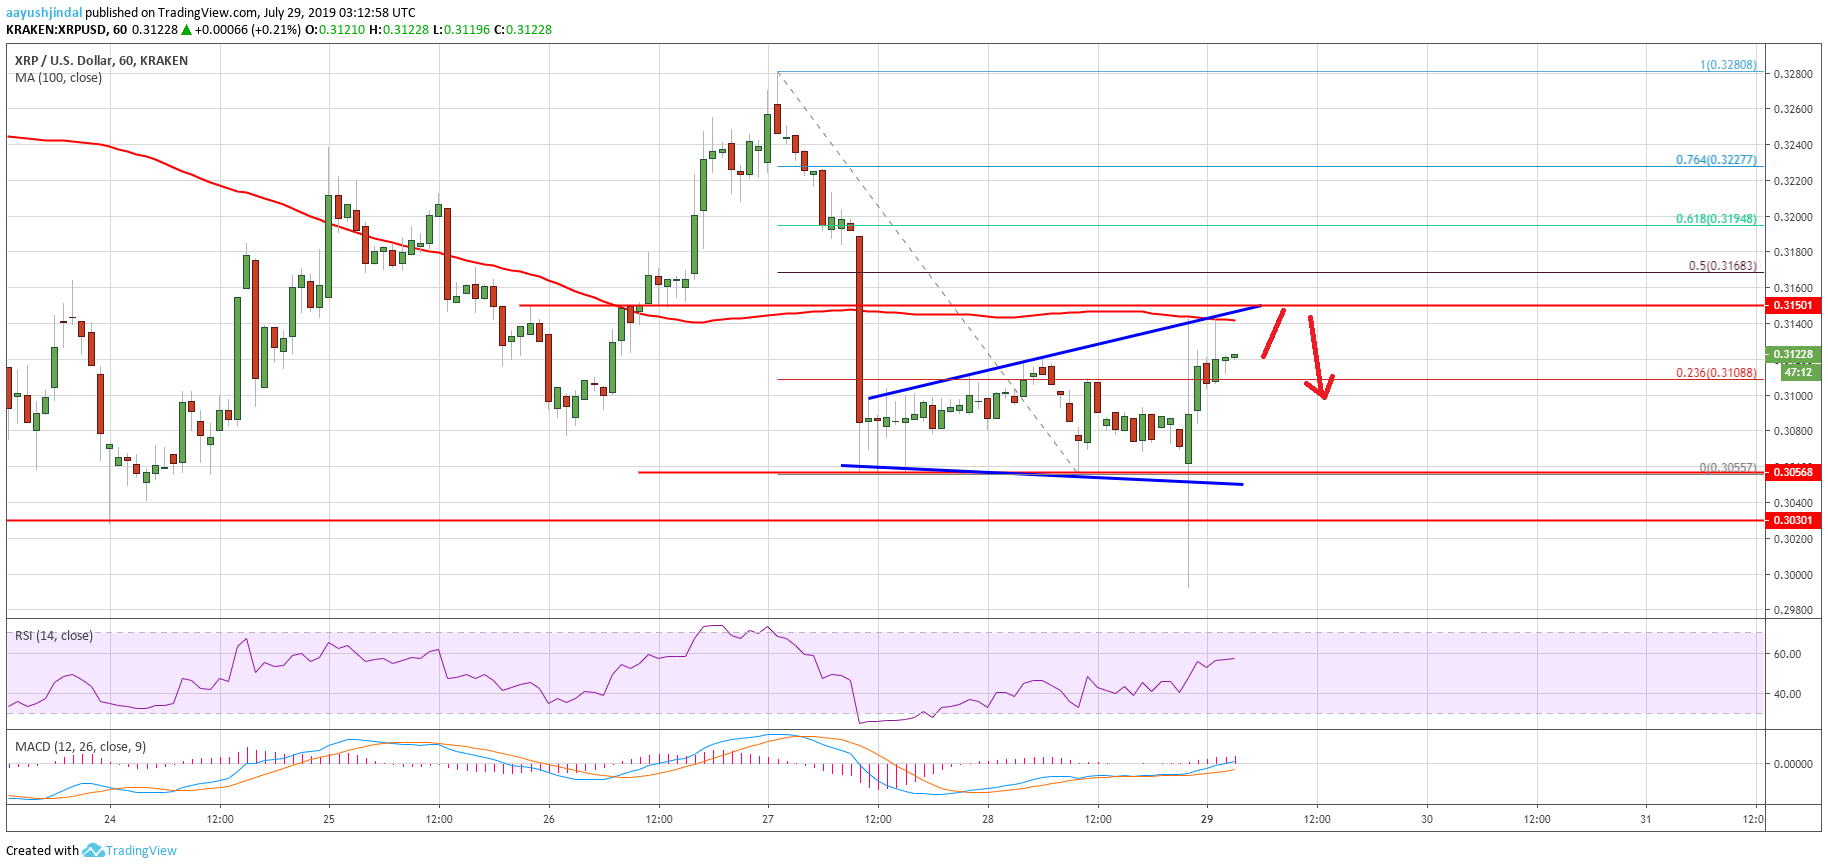
- Ripple price retested the $0.3030 support level and recently corrected higher against the US dollar.
- The price seems to be trading in a range with a strong resistance near the $0.3140 level.
- There is an expanding triangle forming with resistance near $0.3145 on the hourly chart of the XRP/USD pair (data source from Kraken).
- The price could decline again if it continues to struggle near the $0.3140 and $0.3150 resistance levels.
Ripple price is facing a lot of key resistances against the US Dollar and bitcoin. XRP price could extend its losses unless it climbs back above $0.3140 and $0.3200 in the coming sessions.
Ripple Price Analysis
Recently, there was a sharp decline in ripple price from the $0.3280 resistance against the US Dollar. The XRP/USD pair broke many important supports near $0.3200 and $0.3140 to enter a bearish zone. Moreover, the price spiked below the $0.3050 support and the 100 hourly simple moving average. However, the $0.3030 support level acted as a decent support and the price bounced back above $0.3050.
There was a break above the 23.6% Fib retracement level of the downward move from the $0.3280 high to $0.3055 swing low. Besides, the bulls managed to push the price above the $0.3100, but the $0.3140 level acted as a major hurdle. More importantly, there is an expanding triangle forming with resistance near $0.3145 on the hourly chart of the XRP/USD pair.
Clearly, the pair failed to surpass the $0.3150 pivot level and the 100 hourly simple moving average. It also stayed well below the 50% Fib retracement level of the downward move from the $0.3280 high to $0.3055 swing low. It seems like the price is facing a strong resistance near the $0.3150 and $0.3160 levels. To start a strong recovery, the price must break $0.3160 and settle nicely above the 100 hourly SMA.
On the downside, an immediate support is near the $0.3080 level. However, the main supports are near the $0.3050 and $0.3030 levels. If there is a downside break below the $0.3030 support, there could be more losses below the $0.3000 and $0.2980 support levels.
Looking at the chart, ripple price is showing a few bearish signs below $0.3150 while bitcoin managed to move back above $9,500. However, the overall price action suggests range moves above the $0.3030 support level. On the upside, a break above $0.3160 might call for more upsides towards the $0.3280 level.
Technical Indicators
Hourly MACD – The MACD for XRP/USD is currently losing momentum in the bullish zone.
Hourly RSI (Relative Strength Index) – The RSI for XRP/USD is currently above the 50 level.
Major Support Levels – $0.3080, $0.3050 and $0.3030.
Major Resistance Levels – $0.3140, $0.3150 and $0.3160.


