
Reason to trust
How Our News is Made
Strict editorial policy that focuses on accuracy, relevance, and impartiality
Ad discliamer
Morbi pretium leo et nisl aliquam mollis. Quisque arcu lorem, ultricies quis pellentesque nec, ullamcorper eu odio.
- ETH price declined steadily and recently revisited the $200 support level against the US Dollar.
- The price traded as low as $197 and spiked sharply above the $200 and $205 levels.
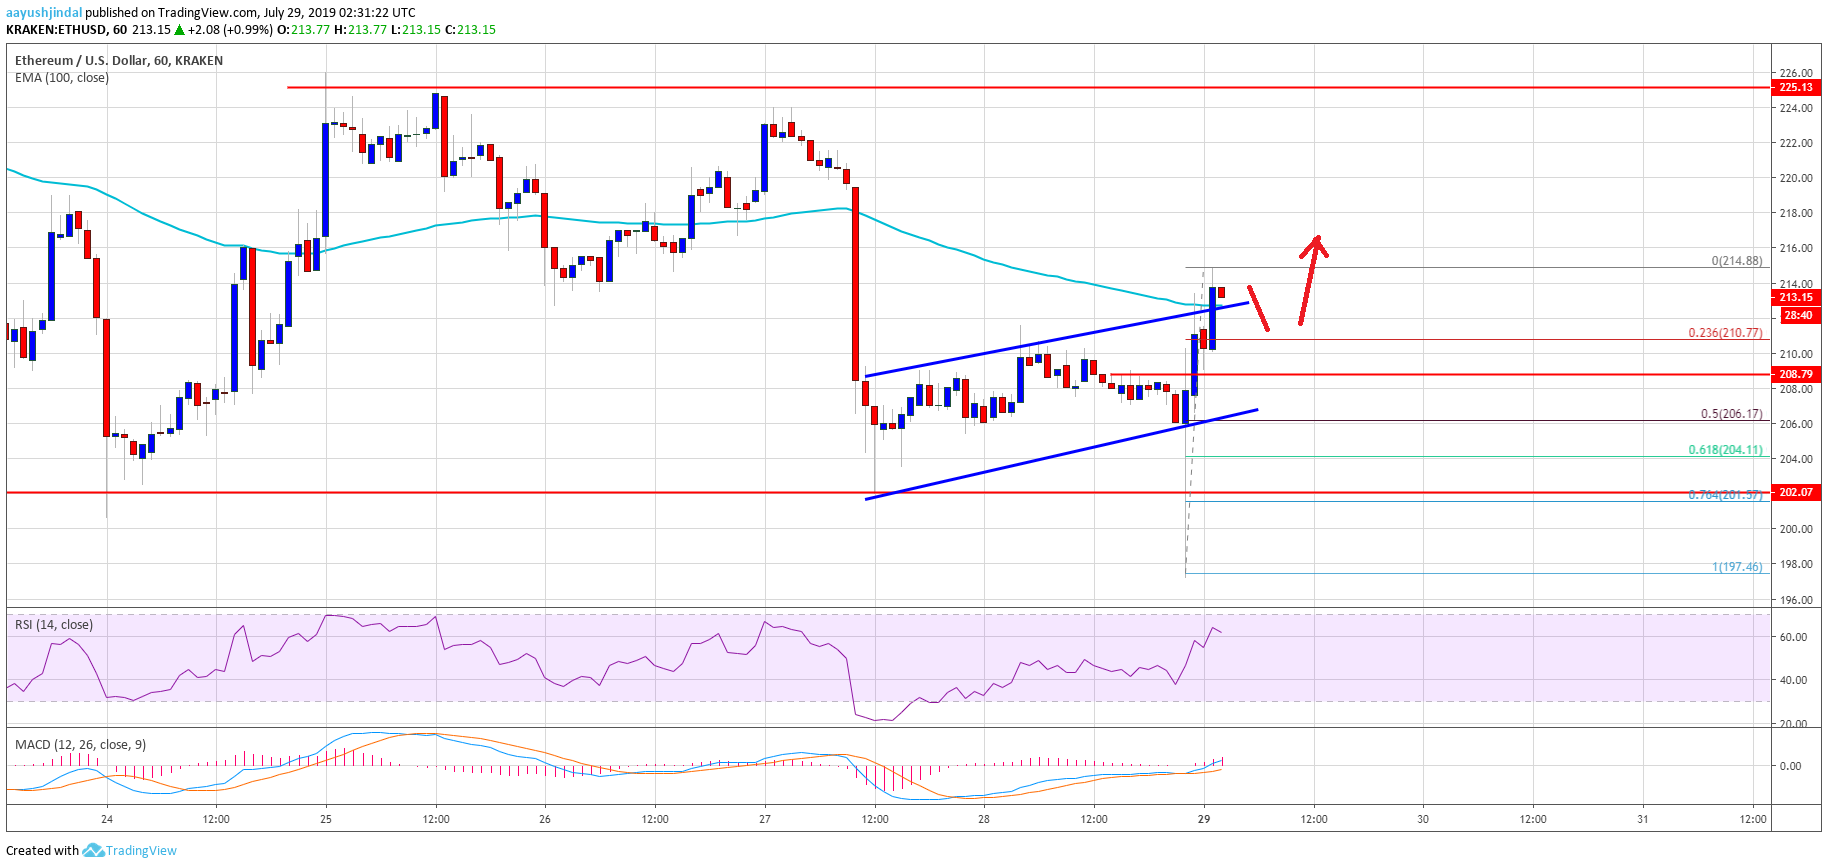
- There was a break above a short term ascending channel with resistance near $210 on the hourly chart of ETH/USD (data feed via Kraken).
- The pair might continue to recover, but it remains in a downtrend as long as below $225.
Ethereum price is currently correcting higher versus the US Dollar and bitcoin. ETH price might climb towards the $220 or $225 resistance where sellers are likely to take a stand.
Ethereum Price Analysis
In the past few days, there was a steady decline in Ethereum price from the $225 resistance against the US Dollar. The ETH/USD pair broke the $210 support level and the 100 hourly simple moving average. Finally, there was a spike below the main $200 support level and a new swing low was formed near $197. However, it seems like the bulls were able to protect the $200 support as the price recovered sharply above $205.
There was a solid recovery above the $205 and $210 resistance levels. Moreover, there was a break above a short term ascending channel with resistance near $210 on the hourly chart of ETH/USD. The pair is now trading above the $210 level and the 100 hourly simple moving average. An immediate support is near the broken channel at $211. Additionally, the 23.6% Fib retracement level of the recent wave from the $197 low to $215 swing high is also near the $210 level.
If the price continues to correct lower, the next support could be near the $206 level. The 50% Fib retracement level of the recent wave from the $197 low to $215 swing high is waiting near the $206 level to provide support. If the price slides below $205, the price is likely to move back towards $200.
On the upside, there are many important resistance levels near the $215, $220 and $225 levels. The main hurdle is near the $225 level, above which the price could turn positive in the coming days. If not, there is a risk of more losses below the $205 and $200 support levels.
Looking at the chart, Ethereum price is clearly correcting higher with a bullish angle above $210. However, this could turn out to be a false move until the bulls gather pace above $220 and $225.
ETH Technical Indicators
Hourly MACD – The MACD for ETH/USD is gaining momentum in the bullish zone.
Hourly RSI – The RSI for ETH/USD is currently climbing higher towards the 70 level.
Major Support Level – $205
Major Resistance Level – $220