
Reason to trust
How Our News is Made
Strict editorial policy that focuses on accuracy, relevance, and impartiality
Ad discliamer
Morbi pretium leo et nisl aliquam mollis. Quisque arcu lorem, ultricies quis pellentesque nec, ullamcorper eu odio.
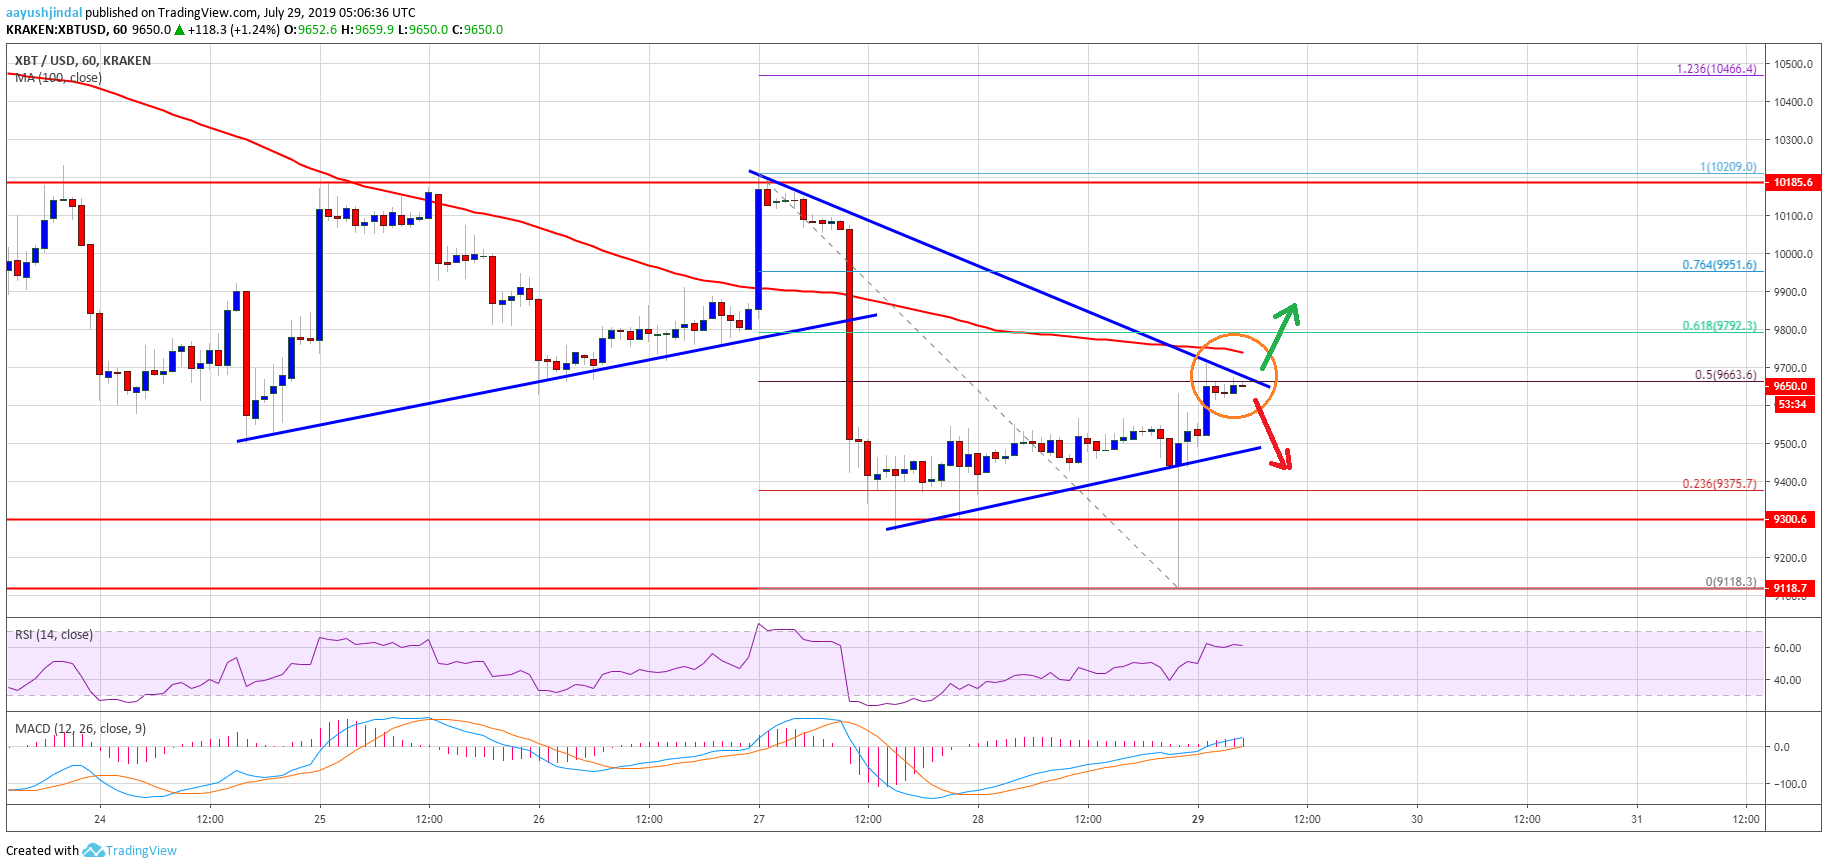
- Bitcoin price declined heavily below the $9,800 and $9,500 support levels against the US Dollar.
- The price traded to a new weekly low at $9,118 and it is currently correcting higher.
- There is a crucial contracting triangle forming with resistance near $9,700 on the hourly chart of the BTC/USD pair (data feed from Kraken).
- The price could either climb above $9,700 and $9,800 or decline sharply towards $9,000.
Bitcoin price is holding the $9,300 support level against the US Dollar. However, BTC price remains at a risk of a fresh drop if it fails to break the $9,700 and $9,800 resistances.
Bitcoin Price Analysis
In the past two days, there bearish sharp bearish moves in bitcoin price below $10,000 against the US Dollar. The BTC/USD pair broke the $9,800 and $9,500 support levels to enter a bearish zone. Moreover, the pair spiked below the $9,300 support and settled below the 100 hourly simple moving average. Finally, the price traded close to the $9,100 level and formed a new weekly low at $9,118 before correcting higher.
It recovered above the $9,300 level plus the 23.6% Fib retracement level of the downward move from the $10,209 high to $9,118 low. The upward move was positive as the price climbed above the $9,500 level. However, the price is now facing a strong resistance near the $9,700 level. More importantly, there is a crucial contracting triangle forming with resistance near $9,700 on the hourly chart of the BTC/USD pair.
Additionally, the 50% Fib retracement level of the downward move from the $10,209 high to $9,118 low is also acting as a strong resistance. Above the $9,700 level, the 100 hourly simple moving average is near the $9,750 level to act as a resistance. The next key resistance is near the $9,800 level, above which the price could stage a decent recovery towards the $10,200 resistance or $10,400.
Conversely, if there is no upside break above $9,700 or $9,800, the price could start a fresh decrease. An immediate support is near the $9,500 level and the triangle support. A clear break below $9,500 might call for a solid drop towards the $9,000 handle in the near term.
Looking at the chart, bitcoin price is facing a strong resistance near $9,700. Therefore, if there is a clear break above $9,700 and a follow through above the 100 hourly SMA, the price could continue to rise positively. If not, there is a risk of another strong decline towards the $9,000 level.
Technical indicators:
Hourly MACD – The MACD is placed nicely in the bullish zone.
Hourly RSI (Relative Strength Index) – The RSI for BTC/USD is currently above the 60 level, with positive signs.
Major Support Levels – $9,500 followed by $9,300.
Major Resistance Levels – $9,700, $9,800 and $10,200.


