Reason to trust
How Our News is Made
Strict editorial policy that focuses on accuracy, relevance, and impartiality
Ad discliamer
Morbi pretium leo et nisl aliquam mollis. Quisque arcu lorem, ultricies quis pellentesque nec, ullamcorper eu odio.
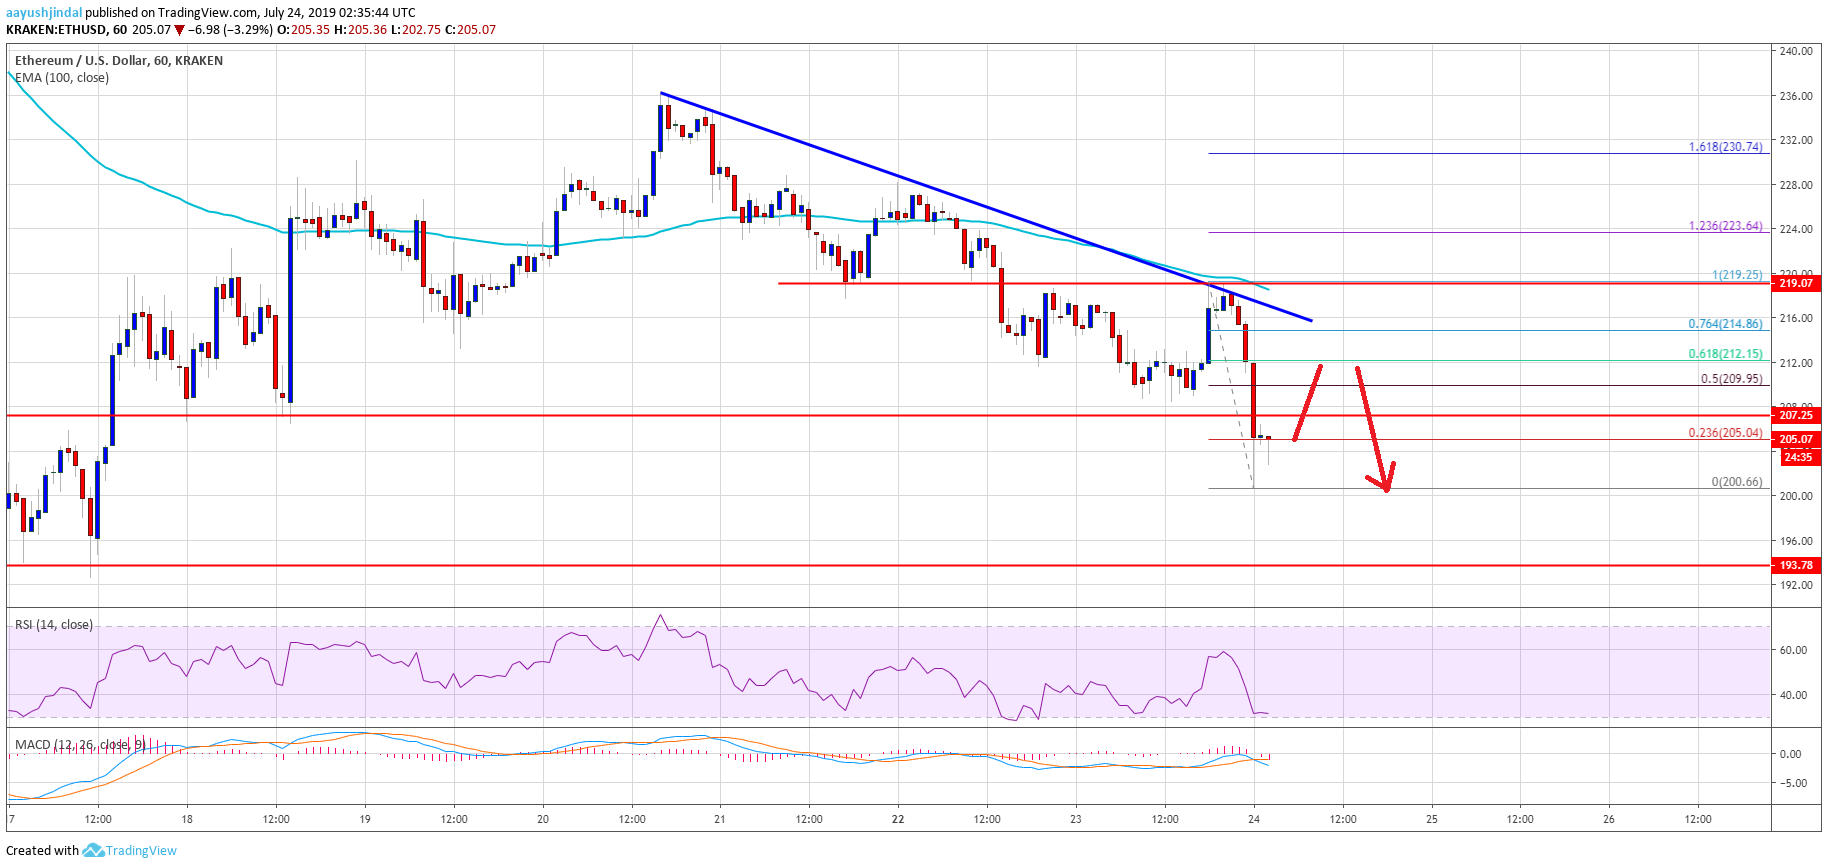
- ETH price remained in a bearish zone and broke the $208 support area against the US Dollar.
- The price tested the $200 support area and it remains at a risk of more losses.
- There is a major bearish trend line forming with resistance near $214 on the hourly chart of ETH/USD (data feed via Kraken).
- The pair is likely to continue lower and it seems like it might soon test the $190 support zone.
Ethereum price is currently trading with a bearish bias versus the US Dollar and bitcoin. ETH price might continue to slide as long as it is below $215 and $220.
Ethereum Price Analysis
This week, Ethereum price mostly traded with a bearish bias below $230 against the US Dollar. The ETH/USD pair broke a few important supports near $220 and $215 to enter a bearish zone. Moreover, there was a close below the $220 level and the 100 hourly simple moving average. The price is currently under a lot of pressure and it even broke the $208 support level.
The bulls are currently defending the $200 support area, but the price remains at a risk of more losses. An immediate resistance is near the $210 level. The 50% Fib retracement level of the recent decline from the $220 high to $200 low is also near the $210 level to act as a resistance. The next key resistance is near the $215 level. Moreover, there is a major bearish trend line forming with resistance near $214 on the hourly chart of ETH/USD.
The 61.8% Fib retracement level of the recent decline from the $220 high to $200 low might also act as a resistance near the $212 level. Therefore, the price is likely to face a lot of hurdles near the $210, $212 and $215 levels. If there is a successful break above the $215 resistance, there are chances of a fresh increase in the near term.
On the other hand, if the price fails to break the $210 or $215 resistance, it could continue to move down. An immediate support is near the $200 level, below which there is a risk of more losses.
Looking at the chart, Ethereum price is clearly trading with a bearish bias below $210. Therefore, it may soon break the $200 support and extend its decline. The next target for the bears could be the $190 support area.
ETH Technical Indicators
Hourly MACD – The MACD for ETH/USD is gaining momentum in the bearish zone, with negative signs.
Hourly RSI – The RSI for ETH/USD is currently well below the 40 level, with a bearish angle.
Major Support Level – $200
Major Resistance Level – $215