
Reason to trust
How Our News is Made
Strict editorial policy that focuses on accuracy, relevance, and impartiality
Ad discliamer
Morbi pretium leo et nisl aliquam mollis. Quisque arcu lorem, ultricies quis pellentesque nec, ullamcorper eu odio.
- ETH price failed to continue higher above the $230 and $240 resistance levels against the US Dollar.
- The price started a fresh decrease and broke the key $220 and $218 support levels.
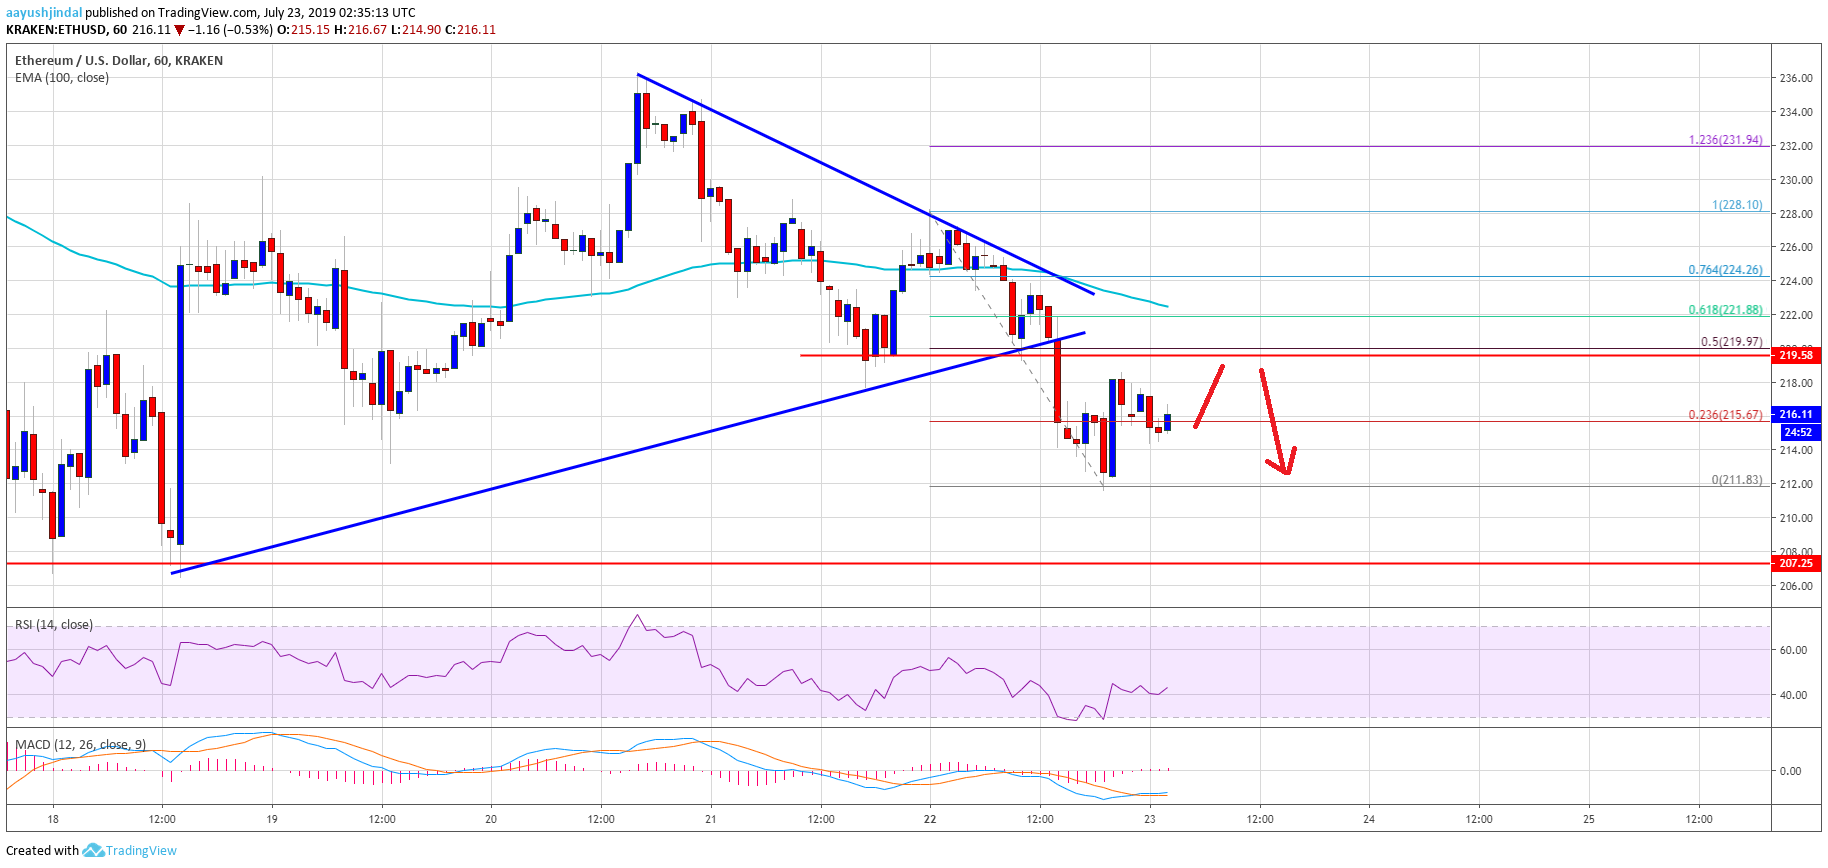
- Yesterday’s highlighted breakout pattern was breached with support near $222 on the hourly chart of ETH/USD (data feed via Kraken).
- The pair is now trading below the $220 support and it might decline further towards the $207 support.
Ethereum price is struggling to gain bullish momentum versus the US Dollar and bitcoin. ETH price remains at a risk of more loses unless it settles above $220 and $224.
Ethereum Price Analysis
After trading towards the $240 level, Ethereum price started a downside correction against the US Dollar. The ETH/USD pair traded below the $230 and $225 support levels. Recently, it consolidated above the $220 support level and near the 100 hourly simple moving average. The price made an attempt to climb back above $230, but the bulls failed to gain momentum.
As a result, there was a downside break below the $220 support level. The price even settled below $220 and the 100 hourly SMA. Moreover, it declined towards the $210 level and a swing low was formed at $211. At the outset, the price is correcting higher towards the $218 and $220 resistances. It broke the 23.6% Fib retracement level of the recent decline from the $228 high to $211 low.
However, the upward move might face a strong resistance near the $220 level. Additionally, the 50% Fib retracement level of the recent decline from the $228 high to $211 low is also near the $220 level to act as a resistance. The main resistance is near the $224 level and the 100 hourly SMA. Therefore, a successful close above $224 is needed for a fresh increase.
On the other hand, if the price fails to break the $218 or $220 resistance, it could continue to decline. An initial support is near the $212 level, below which there is a risk of more losses below $210. The next important support on the downside is near the $207 level.
Looking at the chart, Ethereum price is trading below a major support near $220. Therefore, there is a risk of more losses below $215 and $211 in the coming sessions. To recover, the price must surpass the $220 and $224 resistance levels in the near term.
ETH Technical Indicators
Hourly MACD – The MACD for ETH/USD is struggling to gain pace in the bullish zone, with negative signs.
Hourly RSI – The RSI for ETH/USD is currently moving higher towards the 50 level, with a minor bullish angle.
Major Support Level – $211
Major Resistance Level – $224