
Reason to trust
How Our News is Made
Strict editorial policy that focuses on accuracy, relevance, and impartiality
Ad discliamer
Morbi pretium leo et nisl aliquam mollis. Quisque arcu lorem, ultricies quis pellentesque nec, ullamcorper eu odio.
- Bitcoin price failed to accelerate above $10,700 and declined recently against the US Dollar.
- The price broke the key $10,500 and $10,400 support levels to move into a short term bearish zone.
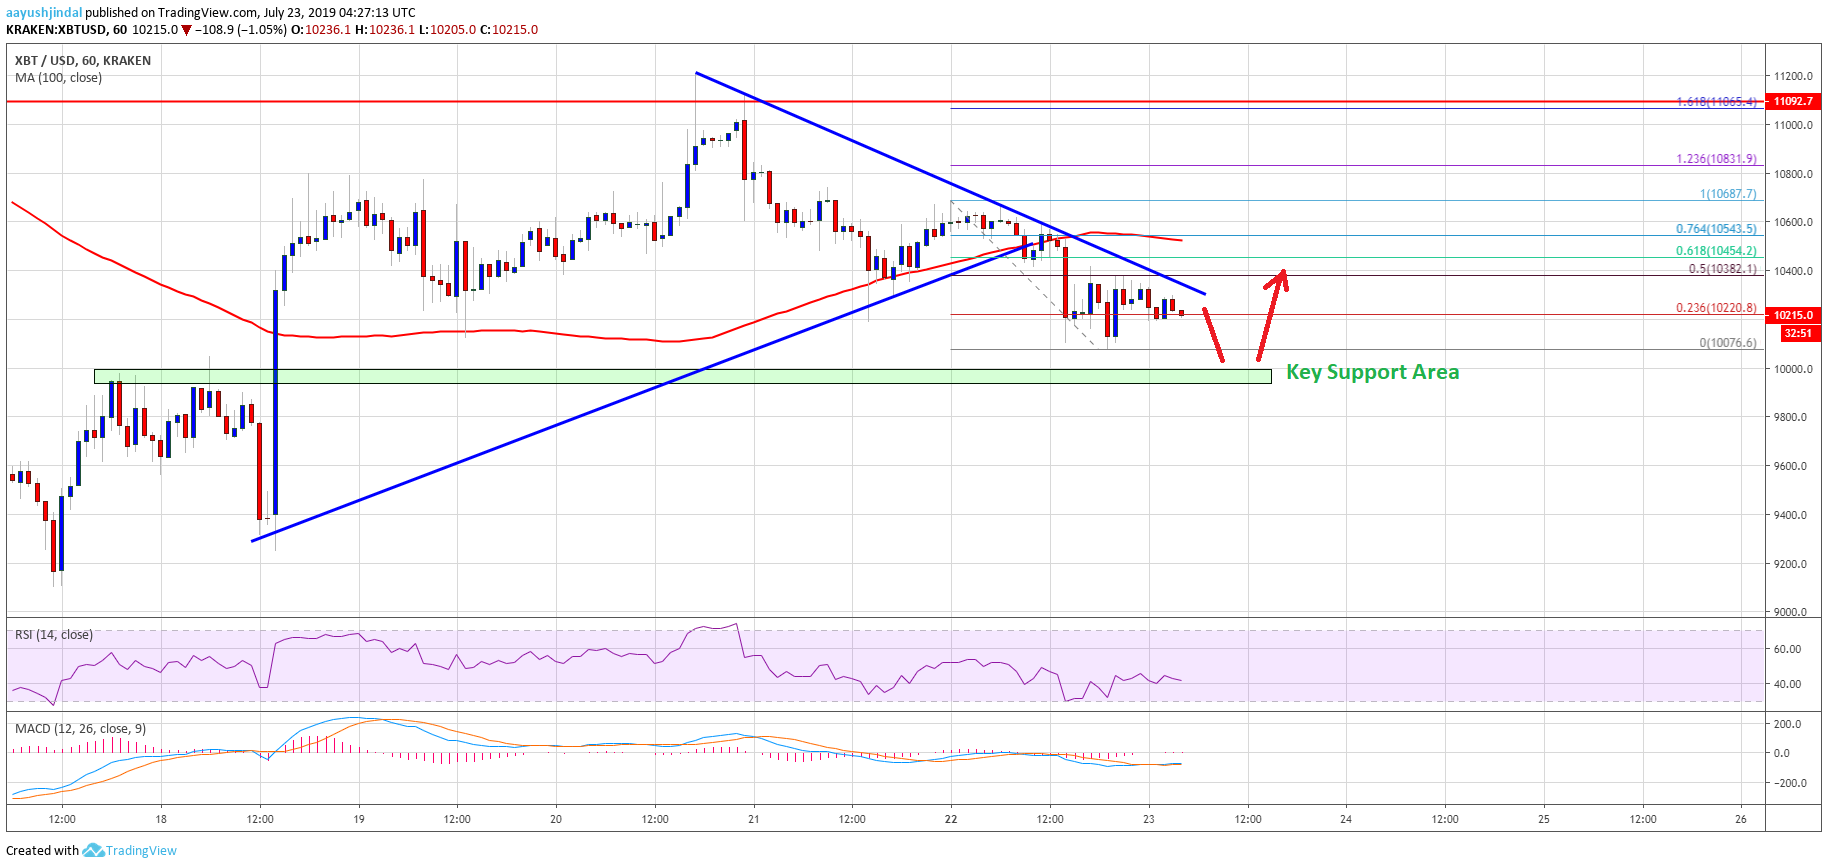
- There is a new bearish trend line forming with resistance near $10,350 on the hourly chart of the BTC/USD pair (data feed from Kraken).
- The price could continue to slide towards the $10,000 and $9,800 support levels in the near term.
Bitcoin price is showing a few bearish signs below the $10,500 support against the US Dollar. BTC price might soon test the key $10,000 support level, where the bulls could emerge.
Bitcoin Price Analysis
Recently, we saw an upward move in bitcoin price above the $10,500 level against the US Dollar. The BTC/USD pair even traded above the $10,600 level, but it failed to surpass the $10,700 resistance. A swing high was formed near $10,687 and the price started a fresh decline. Yesterday, we discussed the chances of a downside thrust and it seems like the current bearish wave could extend below $10,200.
During the decline, there was a break below a bullish trend line forming with support near $10,470 on the hourly chart of the BTC/USD pair. The pair even settled below the $10,500 level and the 100 hourly simple moving average. Finally, the price broke the $10,200 support level and spiked towards $10,100. A swing low was formed at $10,076 and the price is currently correcting higher.
It broke the 23.6% Fib retracement level of the recent drop from the $10,687 high to $10,076 low. However, the price is struggling to break the $10,400 resistance level. Moreover, there is a new bearish trend line forming with resistance near $10,350 on the same chart. Besides, the price was rejected near the 50% Fib retracement level of the recent drop from the $10,687 high to $10,076 low.
The current price action seems bearish, suggesting more losses below $10,200 and $10,100. The price might even spiked below the $10,000 support area. The next important support below $10,000 is near the $9,800 level.
Looking at the chart, bitcoin price is clearly facing a lot of hurdles near $10,400 and $10,500 (the previous supports). To start a decent upward move, the price needs to surpass the $10,500 resistance and the 100 hourly SMA. If not, there is a risk of a downside extension below $10,000 in the near term.
Technical indicators:
Hourly MACD – The MACD is showing negative signs in the bearish zone.
Hourly RSI (Relative Strength Index) – The RSI for BTC/USD is currently well below the 50 level, with a bearish angle.
Major Support Levels – $10,000 followed by $9,800.
Major Resistance Levels – $10,400, $10,500 and $10,800.


