
Reason to trust
How Our News is Made
Strict editorial policy that focuses on accuracy, relevance, and impartiality
Ad discliamer
Morbi pretium leo et nisl aliquam mollis. Quisque arcu lorem, ultricies quis pellentesque nec, ullamcorper eu odio.
- Bitcoin price rallied recently above the $10,000 and $10,200 resistance levels against the US Dollar.
- The price climbed towards the $10,800 resistance and recently started consolidating gains.
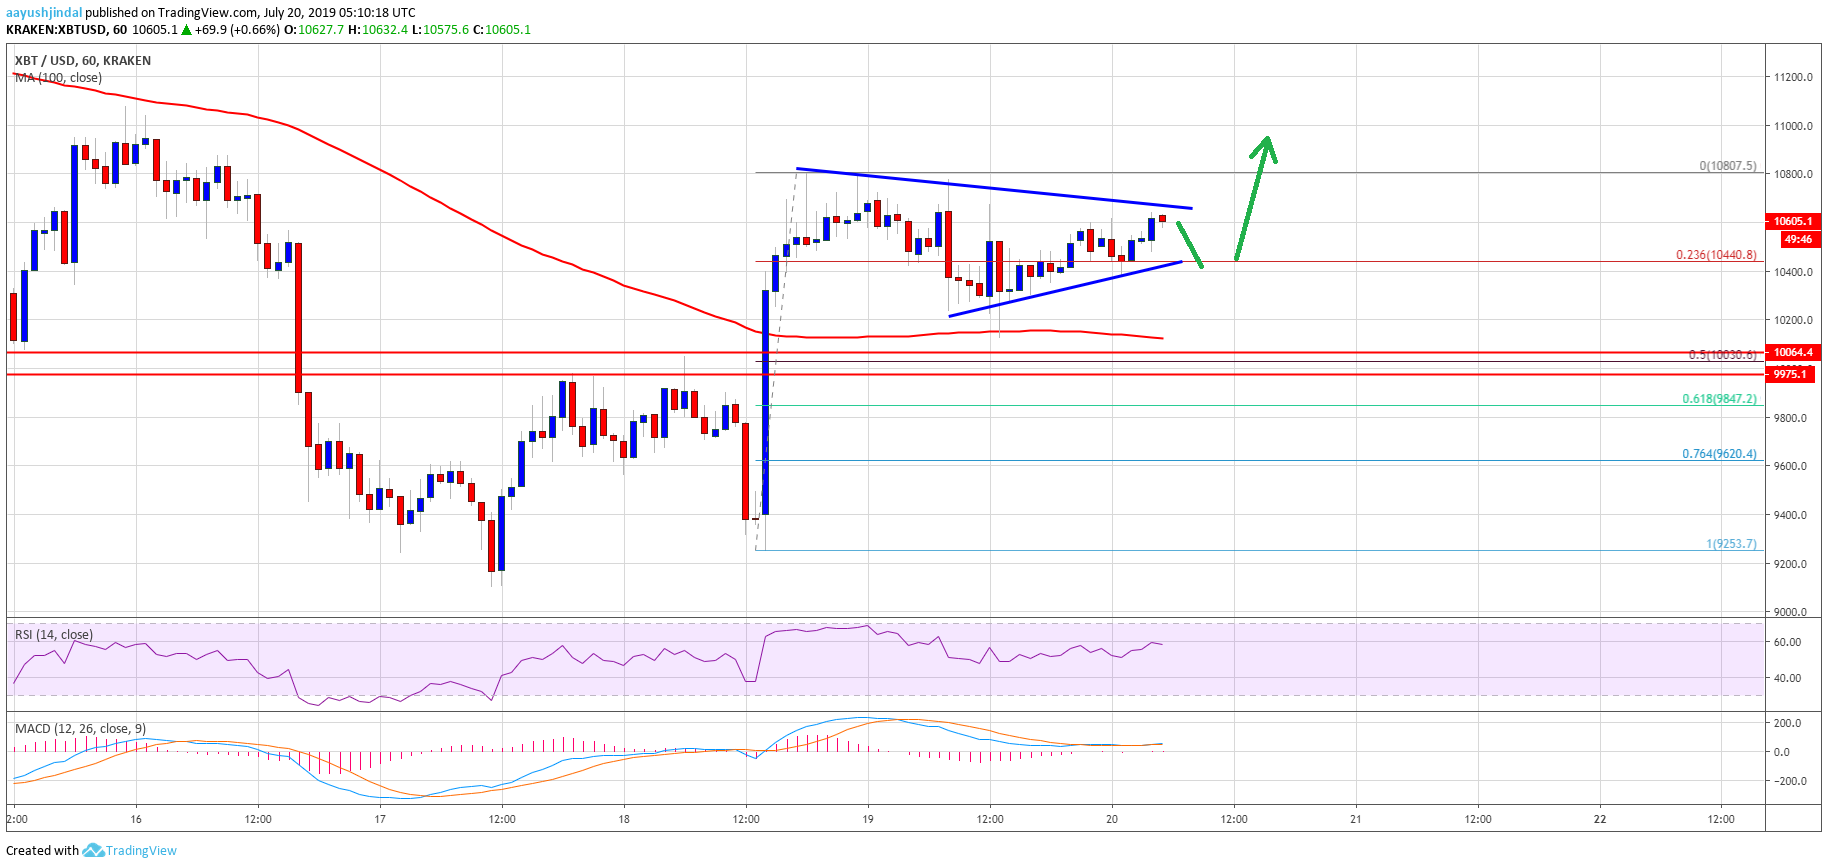
- There is a contracting triangle forming with resistance near $10,700 on the hourly chart of the BTC/USD pair (data feed from Kraken).
- The price could accelerate towards $11,000 and $11,200 if it clears the $10,800 resistance.
Bitcoin price is showing a lot of positive signs above the $10,400 support against the US Dollar. BTC is currently preparing for more upsides and it could rally towards $11,000.
Bitcoin Price Analysis
After a major decline below $10,000, bitcoin price found support above $9,100 against the US Dollar. The BTC/USD pair formed a decent support base above the $9,500 level and recently started a strong recovery. Besides, it broke the key $10,000 resistance to move into a positive zone. Finally, the upward move was such that the price even traded above $10,200 and the 100 hourly simple moving average.
Moreover, the price broke the $10,500 resistance and traded close to the $10,800 level. A swing high was formed near $10,807 and the price started consolidating gains. It corrected below the 23.6% Fib retracement level of the upside move from the $9,253 low to $10,807 high. Additionally, the price even spiked below the $10,400 support level. However, the decline was protected by the $10,200 support and the 100 hourly simple moving average.
At the outset, there is a contracting triangle forming with resistance near $10,700 on the hourly chart of the BTC/USD pair. Therefore, if there is an upside break above the $10,700 and $10,800 resistance levels, the price could continue to rise. The next target for the bulls could be $11,000, above which it could even surge above the $11,200 level. On the downside, a break below $10,440 might push the price towards the $10,200 support.
The next main support is near the $10,000 level. Moreover, the 50% Fib retracement level of the upside move from the $9,253 low to $10,807 high is also above the $10,000 support area. Therefore, a daily close below $10,000 might start a major decline in bitcoin price in the near term.
Looking at the chart, bitcoin price is trading with a positive bias above the $10,200 and $10,000 support levels. As long as the price is above $10,000, it could continue to rise. Overall, the main target for the bulls could be $11,000 and $11,200.
Technical indicators:
Hourly MACD – The MACD is slowly moving back into the bullish zone.
Hourly RSI (Relative Strength Index) – The RSI for BTC/USD is currently moving higher towards the 65 level.
Major Support Levels – $10,400 followed by $10,200.
Major Resistance Levels – $10,800, $11,000 and $11,200.


