Reason to trust
How Our News is Made
Strict editorial policy that focuses on accuracy, relevance, and impartiality
Ad discliamer
Morbi pretium leo et nisl aliquam mollis. Quisque arcu lorem, ultricies quis pellentesque nec, ullamcorper eu odio.
- Ripple price recovered steadily after trading below the $0.2900 support level against the US dollar.
- The price climbed higher and broke the key $0.3000 and $0.3200 resistance levels.
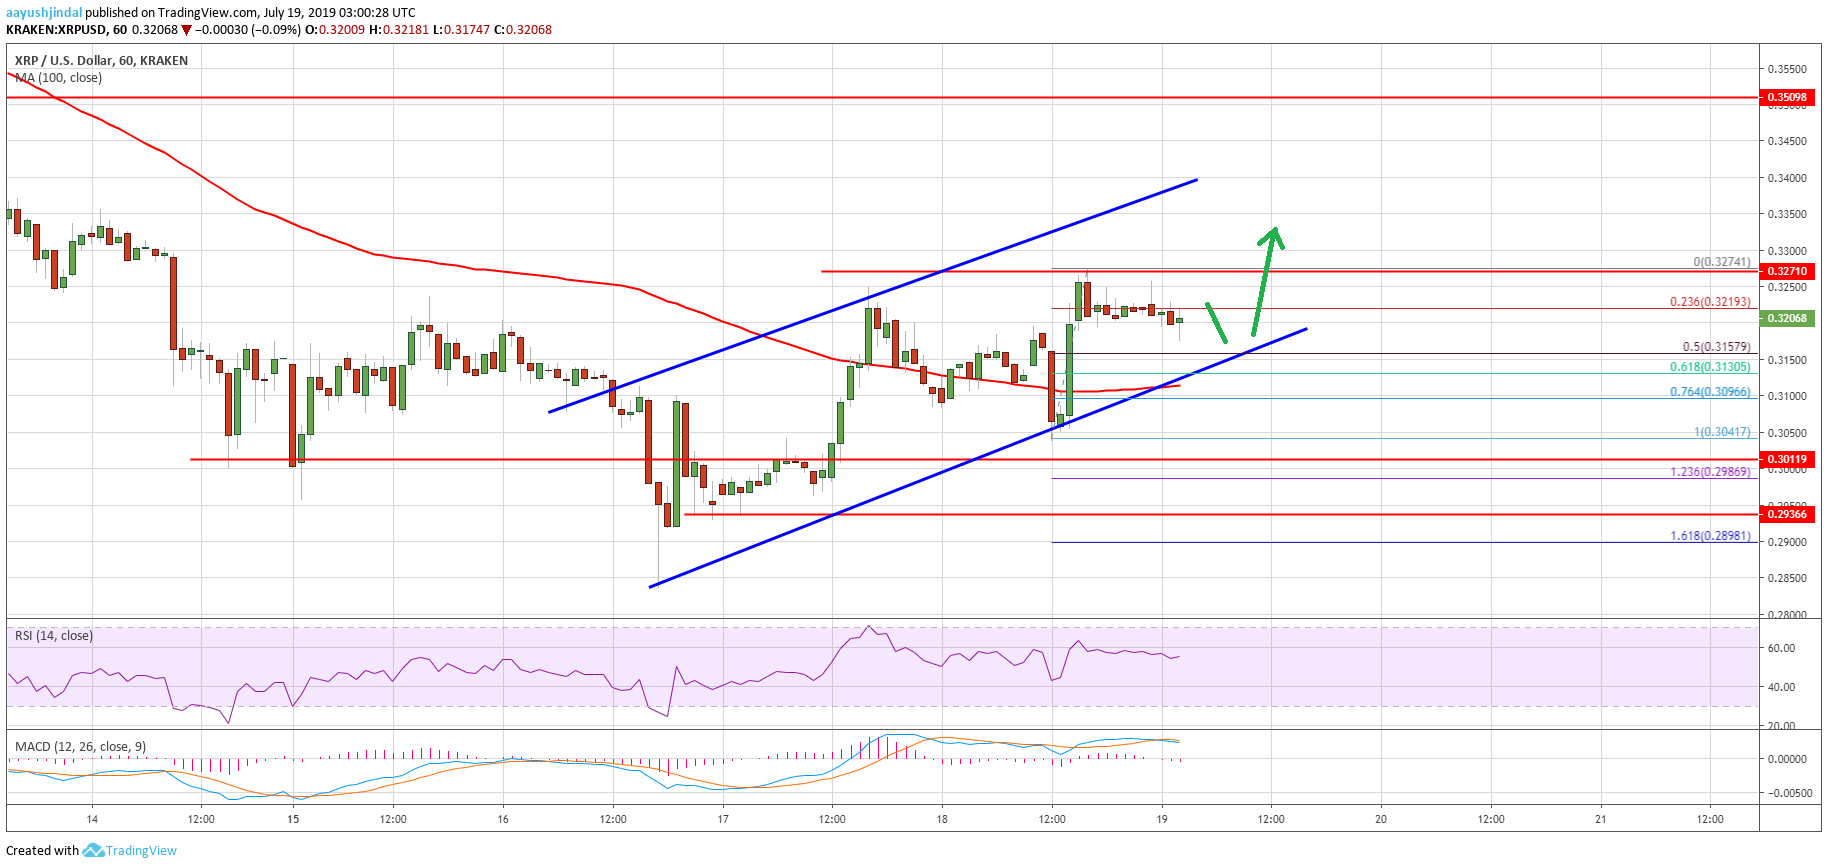
- It seems like an ascending channel is forming with support at $0.3150 on the hourly chart of the XRP/USD pair (data source from Kraken).
- The price is likely to break the $0.3280 resistance and trade above the $0.3320 level in the near term.
Ripple price is showing a lot of positive signs above $0.3200 against the US Dollar since bitcoin rallied 10%. XRP price could continue to rise if its breaks $0.3280 and $0.3300.
Ripple Price Analysis
Recently, we saw a major downward move in ripple price below the $0.3000 support against the US Dollar. The XRP/USD pair even broke the $0.2900 support and tested the $0.2850 support area. A new monthly low was formed near $0.2833 and the price recently started an upside correction. There was a break above the $0.3000 and $0.3100 resistance levels.
Moreover, the price settled above the $0.3100 level and the 100 hourly simple moving average. The bulls gained traction and the price even broke the $0.3200 resistance. Finally, the price spiked above the $0.3240 resistance and traded towards the $0.3280 level. A swing high was formed at $0.3274 and the price is currently correcting lower. It broke the $0.3240 level plus the 23.6% Fib retracement level of the recent wave from the $0.0.3041 low to $0.3274 high.
However, there are many supports on the downside near $0.3200 and $0.3150. There is also an ascending channel forming with support at $0.3150 on the hourly chart of the XRP/USD pair. The 50% Fib retracement level of the recent wave from the $0.0.3041 low to $0.3274 high is also near the channel support to act as a strong support in the near term.
If there is a downside break below the channel support, the price may move back towards the $0.3040 level. However, the 100 hourly SMA at $0.3090 might protect losses. On the upside, an immediate resistance is near the $0.3275 and $0.3280 levels, above which the price is likely to surge above the $0.3300 level in the near term.
Looking at the chart, ripple price is trading with a positive bias above the $0.3150 and $0.3040 support levels. Therefore, there are chances of more gains above the $0.3280 and $0.3300 resistance levels.
Technical Indicators
Hourly MACD – The MACD for XRP/USD is slowly moving back into the bearish zone.
Hourly RSI (Relative Strength Index) – The RSI for XRP/USD is currently correcting lower towards the 50 level, with a bearish angle.
Major Support Levels – $0.3150, $0.3090 and $0.3040.
Major Resistance Levels – $0.3280, $0.3300 and $0.3320.