
Reason to trust
How Our News is Made
Strict editorial policy that focuses on accuracy, relevance, and impartiality
Ad discliamer
Morbi pretium leo et nisl aliquam mollis. Quisque arcu lorem, ultricies quis pellentesque nec, ullamcorper eu odio.
- ETH price started an upside correction and traded above the $210 resistance against the US Dollar.
- The price gained traction above the $220 level and even traded close to the $230 level.
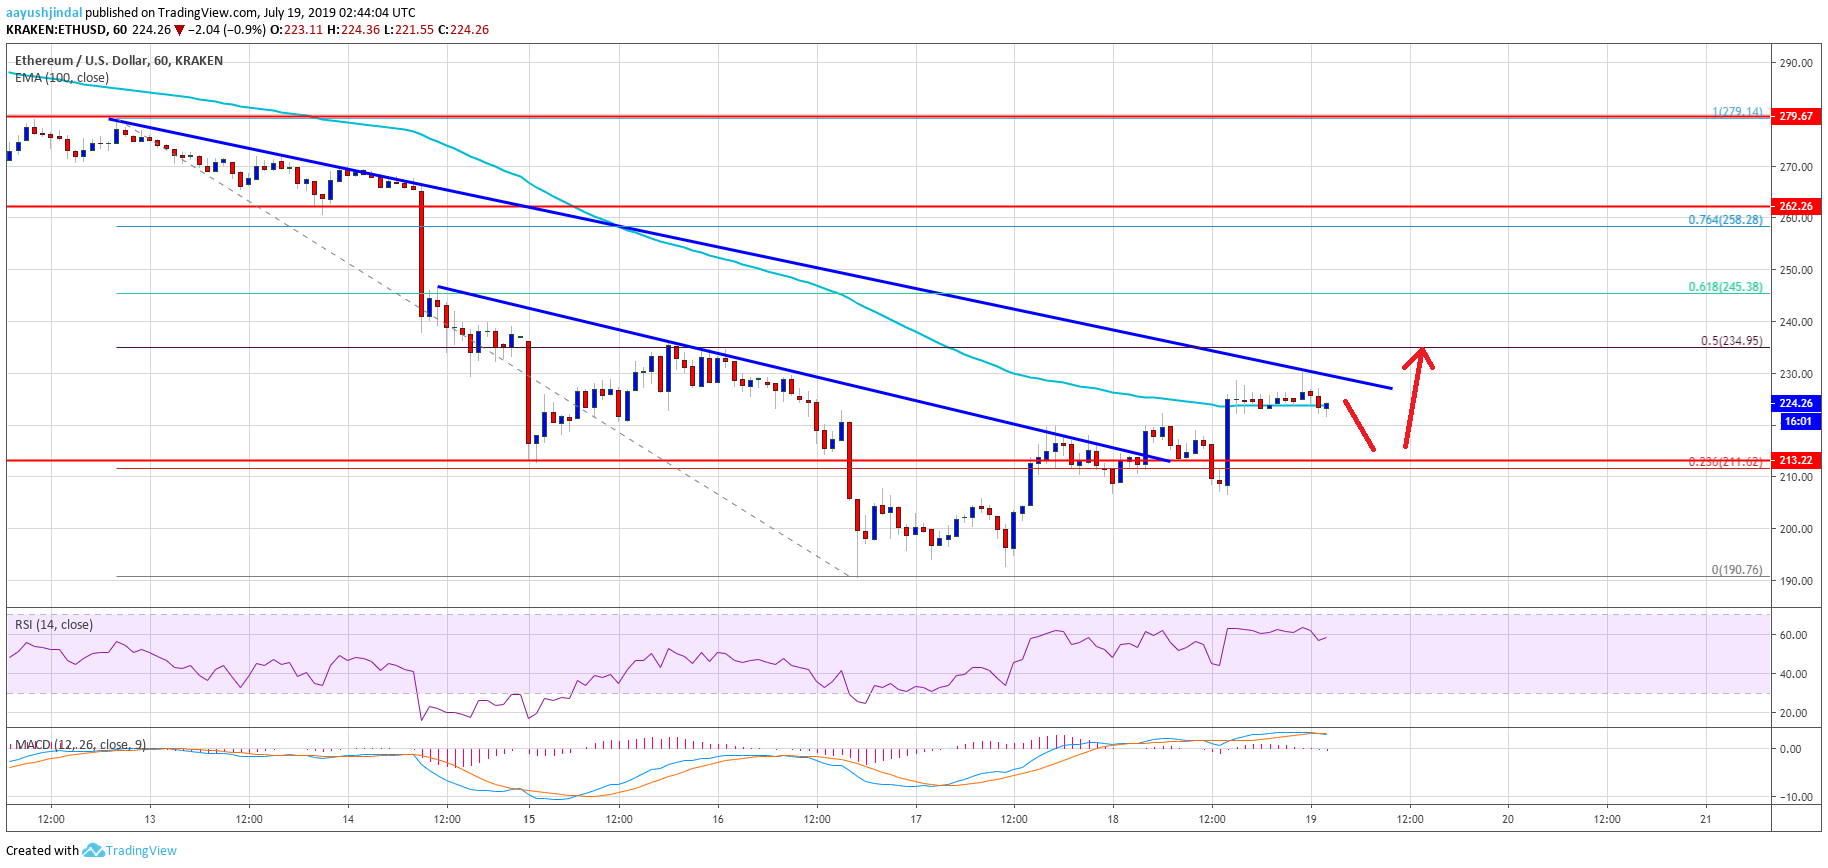
- This week’s followed key bearish trend line is acting as resistance near $230 on the hourly chart of ETH/USD (data feed via Kraken).
- The pair is currently consolidating below the $230 resistance, with support near $212.
Ethereum price is trading with a positive bias above $210 versus the US Dollar, whereas bitcoin jumped 10%. ETH price could dip towards $212 before it could break the $230 resistance.
Ethereum Price Analysis
After a significant decline, Ethereum price found support near the $190 level against the US Dollar. The ETH/USD pair started an upside correction and recently traded above the $200 resistance. Moreover, bitcoin price recovered sharply above $10,000, sparking bullish moves in the crypto market. ETH price gained traction and broke the $210 and $220 resistance levels.
Moreover, there was a close above the $220 level and the 100 hourly simple moving average. The price even broke the 23.6% Fib retracement level of the last major decline from the $229 high to $190 low. Additionally, there was a break above a connecting bearish trend line with resistance at $214 on the hourly chart of ETH/USD. However, the pair ran into this week’s followed key bearish trend linen at $230.
The pair is currently consolidating below the $230 resistance and near the 100 hourly SMA. An initial support is near the $220 level, below which the price may perhaps dip towards the $212 support level. If there are more losses, the price might move back in a bearish zone towards $200 and $195.
On the other hand, if the price gains momentum above the $230 resistance, it could continue to rise. The next key resistance is near the $235 level (the previous swing high) plus the 50% Fib retracement level of the last major decline from the $229 high to $190 low. If there are more gains, the price may even test the $245 level, representing the 61.8% Fib retracement level of the last major decline from the $229 high to $190 low.
Looking at the chart, Ethereum price is showing a few positive signs above the $212 support level. However, the bulls need to gain strength above $230 and $235 to push the price back into a positive zone.
ETH Technical Indicators
Hourly MACD – The MACD for ETH/USD is struggling to gain momentum in the bullish zone.
Hourly RSI – The RSI for ETH/USD is currently well above the 50 level, with a bullish angle.
Major Support Level – $212
Major Resistance Level – $230