
Reason to trust
How Our News is Made
Strict editorial policy that focuses on accuracy, relevance, and impartiality
Ad discliamer
Morbi pretium leo et nisl aliquam mollis. Quisque arcu lorem, ultricies quis pellentesque nec, ullamcorper eu odio.
- Bitcoin price started a strong recovery and broke the key $10,000 resistance area against the US Dollar.
- The price surged more than 10% and broke the $10,500 resistance to test $10,800.
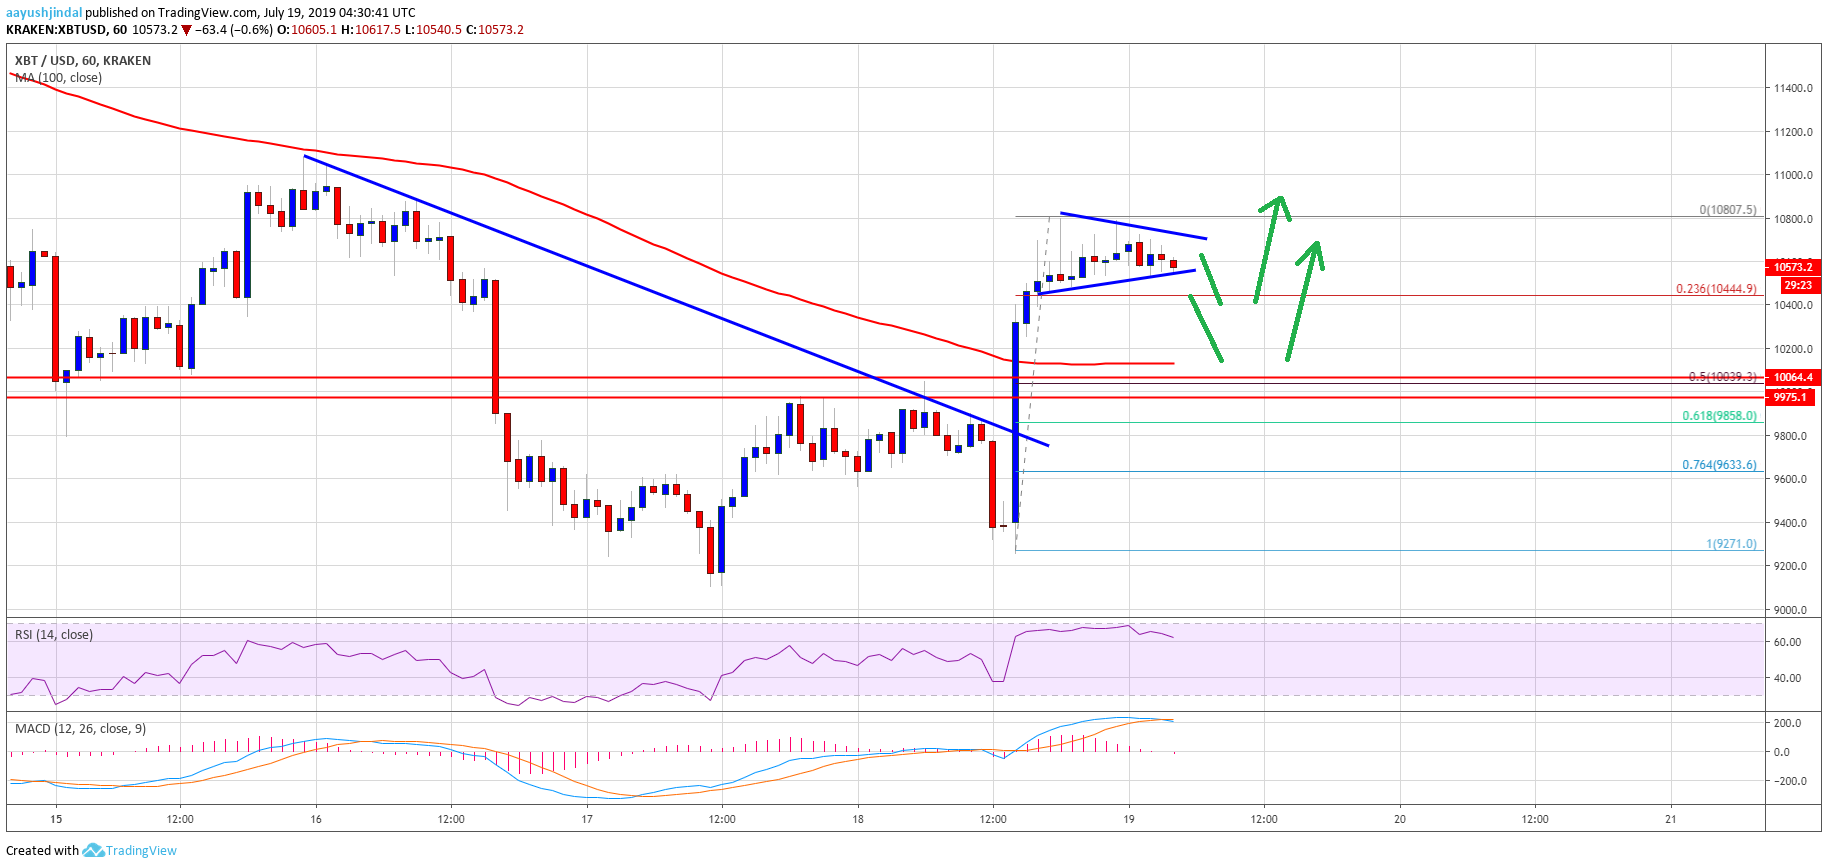
- There was a break above a major bearish trend line with resistance near $9,800 on the hourly chart of the BTC/USD pair (data feed from Kraken).
- The price traded as high as $10,807 and it is currently consolidating gains.
Bitcoin price surged more than 10% above $10,500 against the US Dollar. BTC is currently consolidating gains and dips are likely to find a strong support above $10,000 and $10,200.
Bitcoin Price Analysis
In the past few days, we saw a major drop in bitcoin price below the $10,000 support against the US Dollar. The BTC/USD pair traded close the $9,000 support level and formed a new monthly low near $9,095. Later, the price formed a decent support base above $9,400 and recently started an upward move. It surged more than $1,000 and broke the key $10,000 resistance.
There was a break above the 61.8% Fib retracement level of the last key drop from the $11,060 swing high to $9,100 swing low. Moreover, there was a break above a major bearish trend line with resistance near $9,800 on the hourly chart of the BTC/USD pair. The pair even settled above the $10,400 level and the 100 hourly simple moving average. The upward move was such that the price tested the $10,800 resistance and a swing high was formed near $10,807.
The price is currently consolidating below $10,800 and trading inside a contracting triangle. If there is a downside break, the price could test $10,440 or the 23.6% Fib retracement level of the recent wave from the $9,271 low to $10,807 high. However, the main support on the downside is near the $10,200 level and the 100 hourly simple moving average.
Moreover, the 50% Fib retracement level of the recent wave from the $9,271 low to $10,807 high is also near the $10,040 level. Therefore, dips towards the $10,400 and $10,200 levels are likely to find a lot of buyers. On the upside, a break above the $10,800 resistance might start another rise.
Looking at the chart, bitcoin price is clearly trading in a positive zone above the $10,200 and $10,400 support levels. If there are more gains above $10,800, the price might move towards the $11,500 level in the near term.
Technical indicators:
Hourly MACD – The MACD is slowly moving back into the bearish zone.
Hourly RSI (Relative Strength Index) – The RSI for BTC/USD is currently correcting from 70 and it could test 55.
Major Support Levels – $10,400 followed by $10,200.
Major Resistance Levels – $10,800, $11,000 and $11,500.


