
Reason to trust
How Our News is Made
Strict editorial policy that focuses on accuracy, relevance, and impartiality
Ad discliamer
Morbi pretium leo et nisl aliquam mollis. Quisque arcu lorem, ultricies quis pellentesque nec, ullamcorper eu odio.
- Ripple price found support near the $0.2830 level and recovered recently against the US dollar.
- The price traded above the $0.2940 resistance and the $0.3000 pivot level.
- This week’s followed bearish trend line was breached with resistance near $0.3040 on the hourly chart of the XRP/USD pair (data source from Kraken).
- The price is now trading with a few positive signs above the $0.3050 support area.
Ripple price is currently trading with a bullish angle against the US Dollar and bitcoin. XRP price could extend its recovery if there is an upside break above the $0.3230 resistance area.
Ripple Price Analysis
Yesterday, we saw a strong drop in bitcoin and Ethereum, but dips were limited in ripple price against the US Dollar. The XRP/USD pair broke the $0.2940 support level and traded to a new monthly low. A swing low was formed near $0.2833 and recently the price started an upside correction. There was a break above the $0.2940 and $0.3000 resistance levels to start a recovery.
Moreover, this week’s followed bearish trend line was breached with resistance near $0.3040 on the hourly chart of the XRP/USD pair. It opened the doors for more gains above the $0.3150 resistance. However, the upward move is facing hurdles near the $0.0.3230 and $0.3240 resistance levels. As a result, the price corrected gains below $0.3150 and the 100 hourly simple moving average. Besides, there was a break below the 23.6% Fib retracement level of the recent wave from the $0.2833 low to $0.3248 high.
However, there are many supports on the downside near the $0.3050 and $0.3040 levels. The 50% Fib retracement level of the recent wave from the $0.2833 low to $0.3248 high is also near the $0.3040 level. There is also a connecting bullish trend line forming with support at $0.3045 on the same chart.
Therefore, the price is likely to find bids near the $0.3040 or $0.3050 level. Below the trend line and $0.3040, the price may perhaps test the $0.3000 pivot level. On the upside, the main resistance is near the $0.3230 and $0.3240 levels. If there is a convincing break above $0.3240, the price could accelerate gains in the near term.
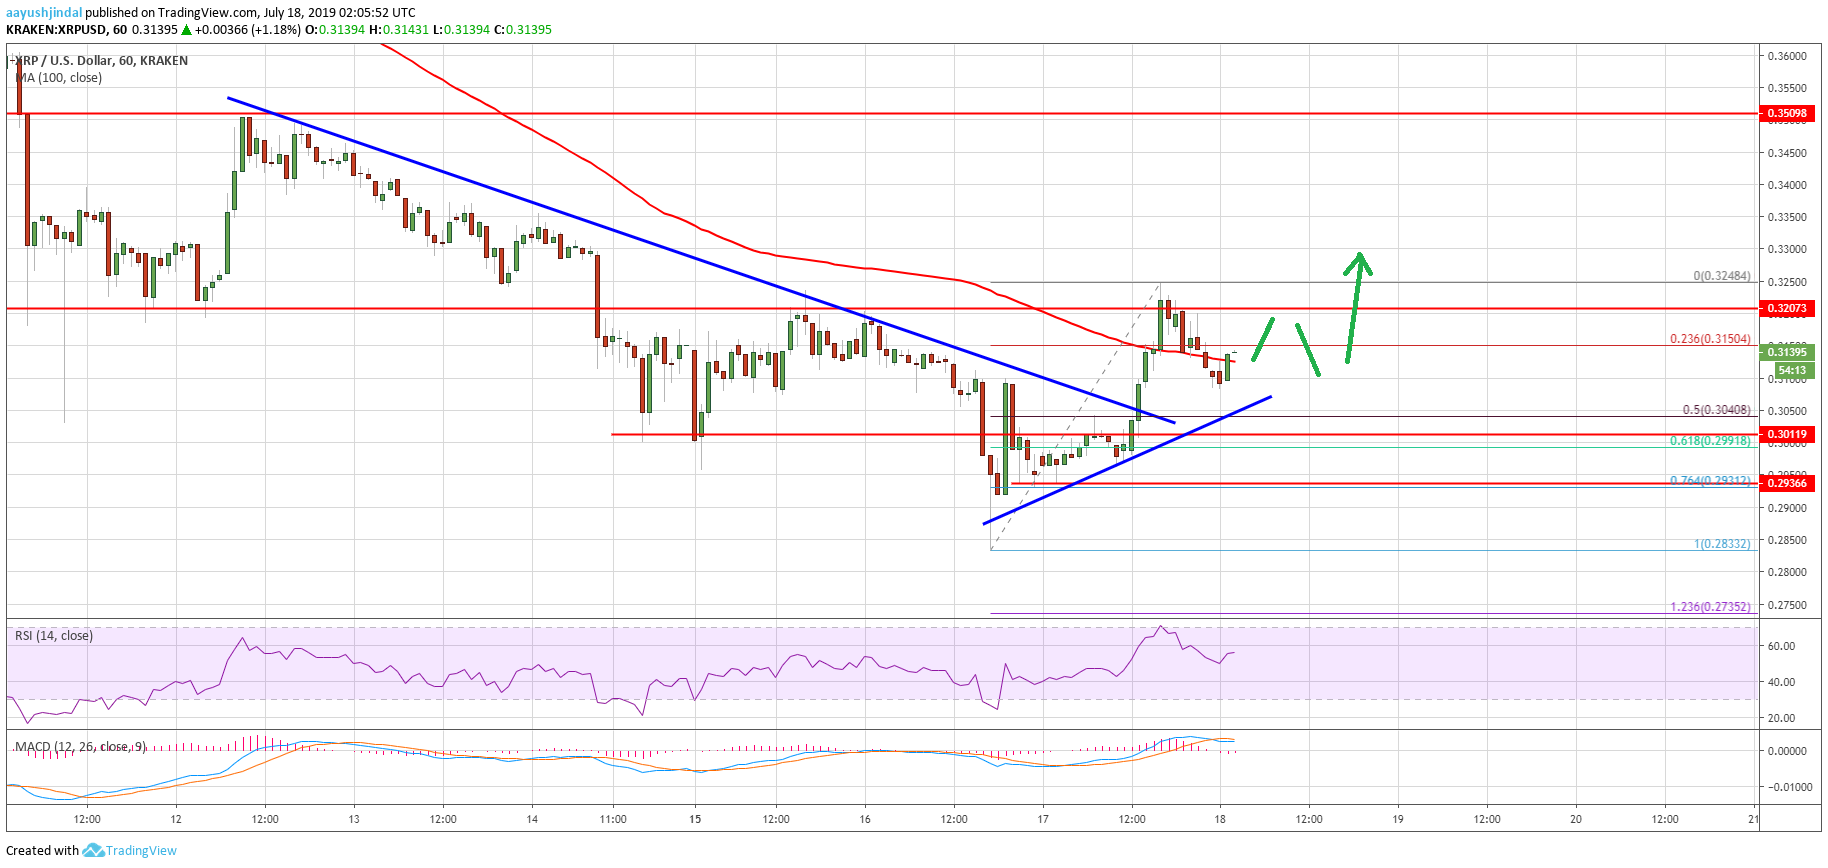
Looking at the chart, ripple price remains well bid above the $0.3040 level. As long as there is no close below $0.3000, the price is likely to continue higher. A clear break above $0.3240 might push the price to $0.3450.
Technical Indicators
Hourly MACD – The MACD for XRP/USD is likely to gain strength in the bullish zone.
Hourly RSI (Relative Strength Index) – The RSI for XRP/USD is currently above the 50 level, with a bullish angle.
Major Support Levels – $0.3050, $0.3040 and $0.3000.
Major Resistance Levels – $0.3230, $0.3240 and $0.3320.


