Reason to trust
How Our News is Made
Strict editorial policy that focuses on accuracy, relevance, and impartiality
Ad discliamer
Morbi pretium leo et nisl aliquam mollis. Quisque arcu lorem, ultricies quis pellentesque nec, ullamcorper eu odio.
- Ripple price failed to climb above the $0.3230 resistance and resumed decline against the US dollar.
- The price broke the $0.3000 support level and traded to a new monthly low at $0.2835.
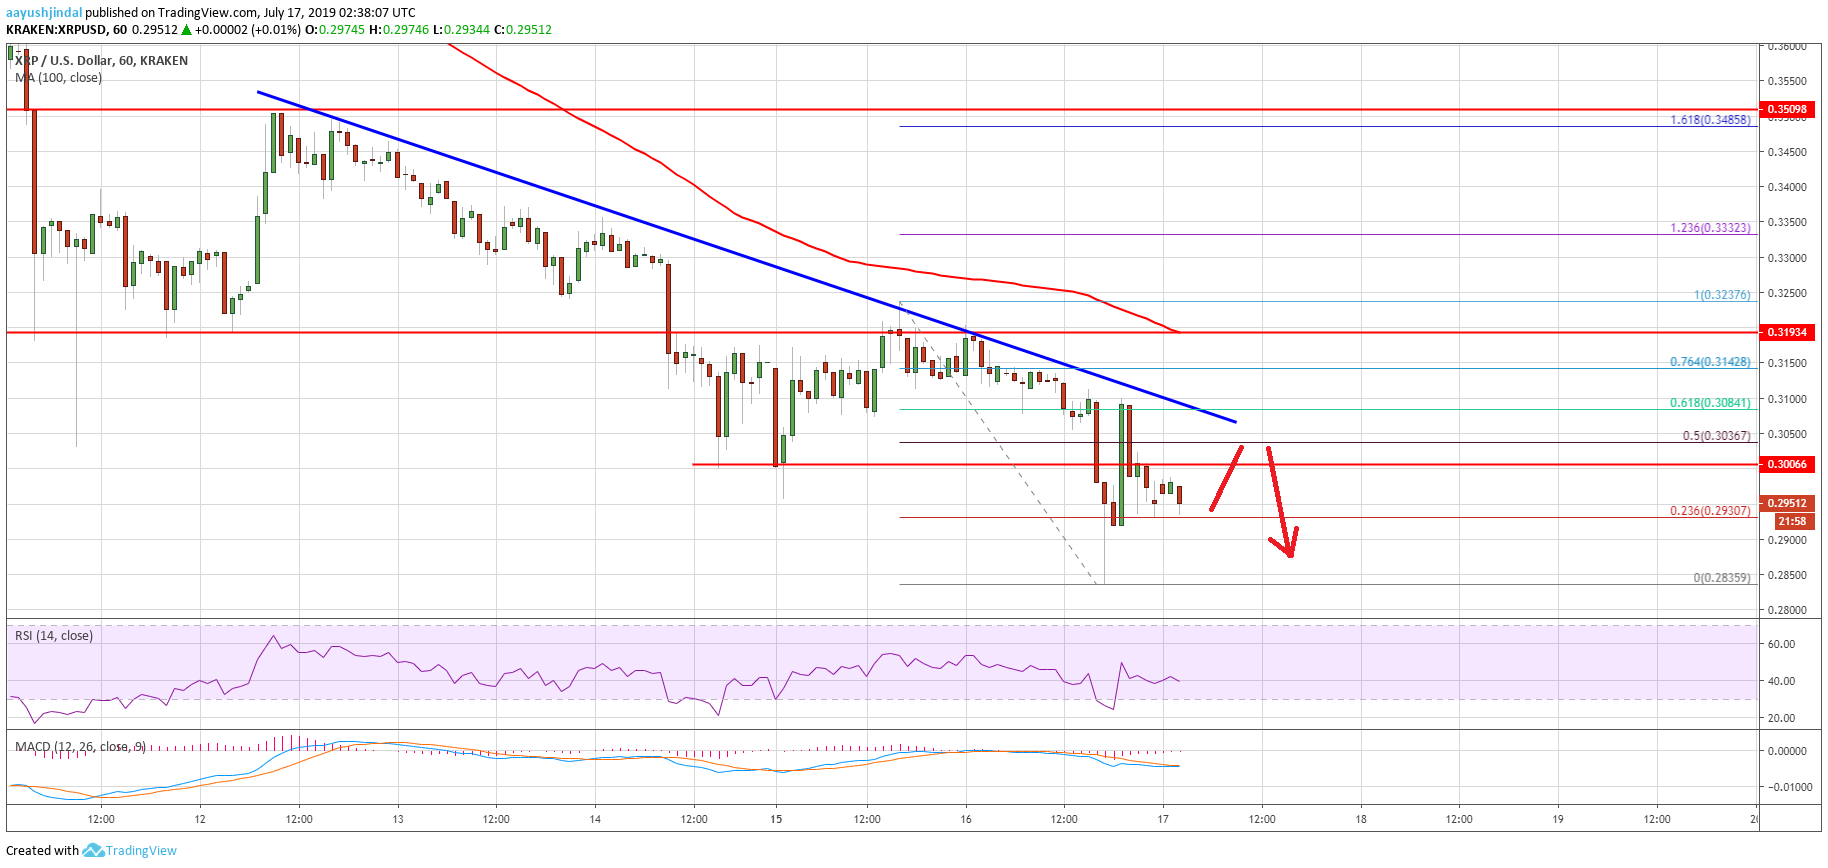
- This week’s followed bearish trend line is active with resistance at $0.3075 on the hourly chart of the XRP/USD pair (data source from Kraken).
- The price could decline below $0.2800 if it continues to struggle near $0.3075 and $0.3100.
Ripple price is holding an important support against the US Dollar, while bitcoin and Ethereum dived nearly 15%. XRP price could extend its decline if there is a break below the $0.2800 support.
Ripple Price Analysis
Yesterday, we saw a decent upside correction in ripple price above $0.3100 against the US Dollar. However, the XRP/USD pair struggled to gain momentum above the $0.3200 and $0.3230 resistance levels. The price topped near the $0.3230 level and remained well below the 100 hourly simple moving average. As a result, there was a fresh bearish reaction and the price declined below the $0.3150 and $0.3100 support levels.
More importantly, the recent significant decline bitcoin and Ethereum pushed ripple price below the $0.3000 support level. However, losses were limited and the price traded to a new monthly low at $0.2835. It even corrected higher above the $0.3000 level plus the 50% Fib retracement level of the recent decline from the $0.3237 high to $0.2835 low. The upward move was capped by the $0.3080 level.
The price failed to break the 61.8% Fib retracement level of the recent decline from the $0.3237 high to $0.2835 low. Moreover, this week’s followed bearish trend line is active with resistance at $0.3075 on the hourly chart of the XRP/USD pair. Therefore, the price might struggle to break the $0.3075 and $0.3100 resistance levels. If there is an upside break above $0.3100, the price could correct towards the $0.3200 level and the 100 hourly SMA.
On the other hand, if the price fails to break the $0.3100 resistance, it could slide again. An immediate support is near the $0.2900 level, below which the price may even break the recent low at $0.2835. The next important support is near the $0.2800 and $0.2780 levels.
Looking at the chart, ripple price is currently struggling to gain bullish momentum above $0.3000. Therefore, there is a risk of more losses below the $0.2900 and $0.2800 levels in the near term.
Technical Indicators
Hourly MACD – The MACD for XRP/USD is struggling to move back into the bullish zone.
Hourly RSI (Relative Strength Index) – The RSI for XRP/USD is currently near the 40 level, with a bearish angle.
Major Support Levels – $0.2850, $0.2800 and $0.2780.
Major Resistance Levels – $0.3075, $0.3100 and $0.3200.