
Reason to trust
How Our News is Made
Strict editorial policy that focuses on accuracy, relevance, and impartiality
Ad discliamer
Morbi pretium leo et nisl aliquam mollis. Quisque arcu lorem, ultricies quis pellentesque nec, ullamcorper eu odio.
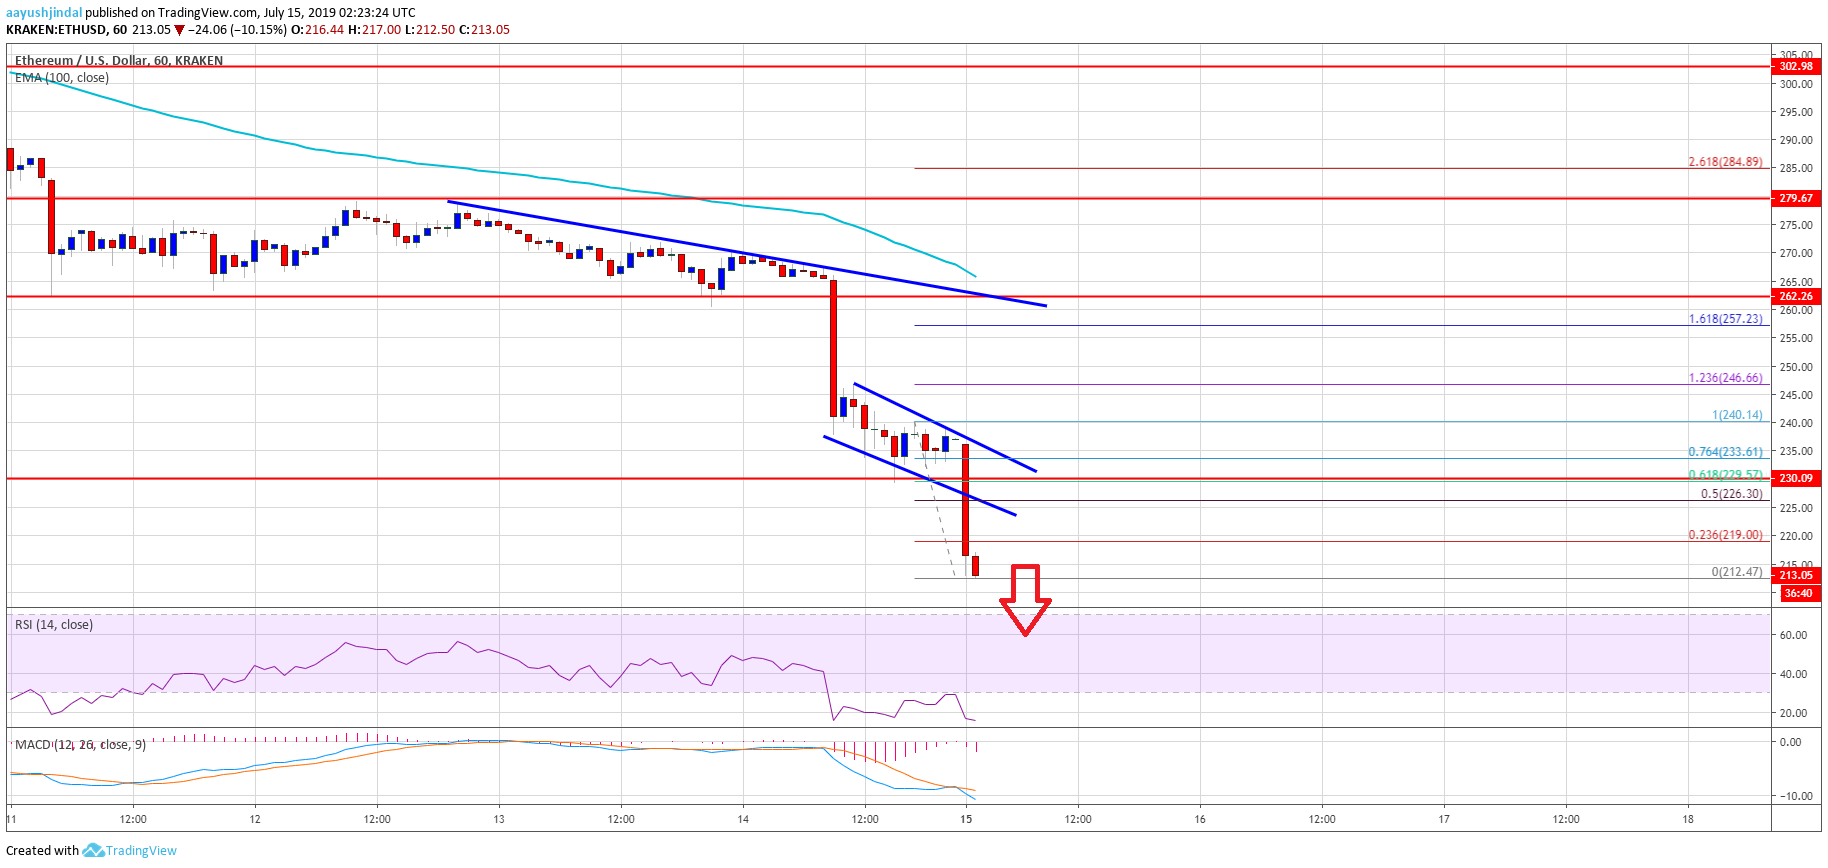
- ETH price declined heavily below key supports against the US Dollar and bitcoin.
- The price broke the key $260, $230 and $222 support levels to register 20% losses.
- There was a break below a short term declining channel with support near $227 on the hourly chart of ETH/USD (data feed via Kraken).
- The pair is heading towards the $200 support area, where the bulls may take a stand.
Ethereum price fell significantly below $250 and 0.0250 versus the US Dollar and bitcoin respectively. ETH price remains at a risk of more losses if it breaks $200.
Ethereum Price Analysis
In the past three sessions, there was a massive decline in bitcoin, Ethereum, ripple and other major altcoins against the US Dollar. ETH/USD started a solid drop after it broke the key $275 and $260 support levels. The price declined more than 20% and even broke the $230 support area. Moreover, the price broke the $222 support and settled well below the 100 hourly simple moving average. The price traded close to the $210 level and formed a new monthly low at $212.
It is currently trading with a bearish angle, with an initial resistance near the $220 level. The 23.6% Fib retracement level of the recent decline from the $240 high to $212 low is near the $219 level to act as a resistance. Besides, there was a break below a short term declining channel with support near $227 on the hourly chart of ETH/USD. The same channel might act as a resistance near the $225 level.
The 50% Fib retracement level of the recent decline from the $240 high to $212 low is also near $226 to act as a significant resistance. To start a decent recovery, the price has to move back above the $230 pivot level. In the mentioned case, it could even recover towards the $240 level.
Conversely, if there is no upside recovery above $220 or $225, the price could extend losses. An initial support is near the $212 low, below which the price is likely to test the $200 support area. The bulls are likely to appear near the $200 level and defend more losses.
Looking at the chart, Ethereum price is under a lot of pressure vs the US Dollar and bitcoin. The main support is near the $200 level. If the bulls fail to defend the $200 support, there are chances of more losses in the near term.
ETH Technical Indicators
Hourly MACD – The MACD for ETH/USD is currently gaining pace in the bearish zone.
Hourly RSI – The RSI for ETH/USD is now near the extreme oversold readings.
Major Support Level – $200
Major Resistance Level – $225


