
Reason to trust
How Our News is Made
Strict editorial policy that focuses on accuracy, relevance, and impartiality
Ad discliamer
Morbi pretium leo et nisl aliquam mollis. Quisque arcu lorem, ultricies quis pellentesque nec, ullamcorper eu odio.
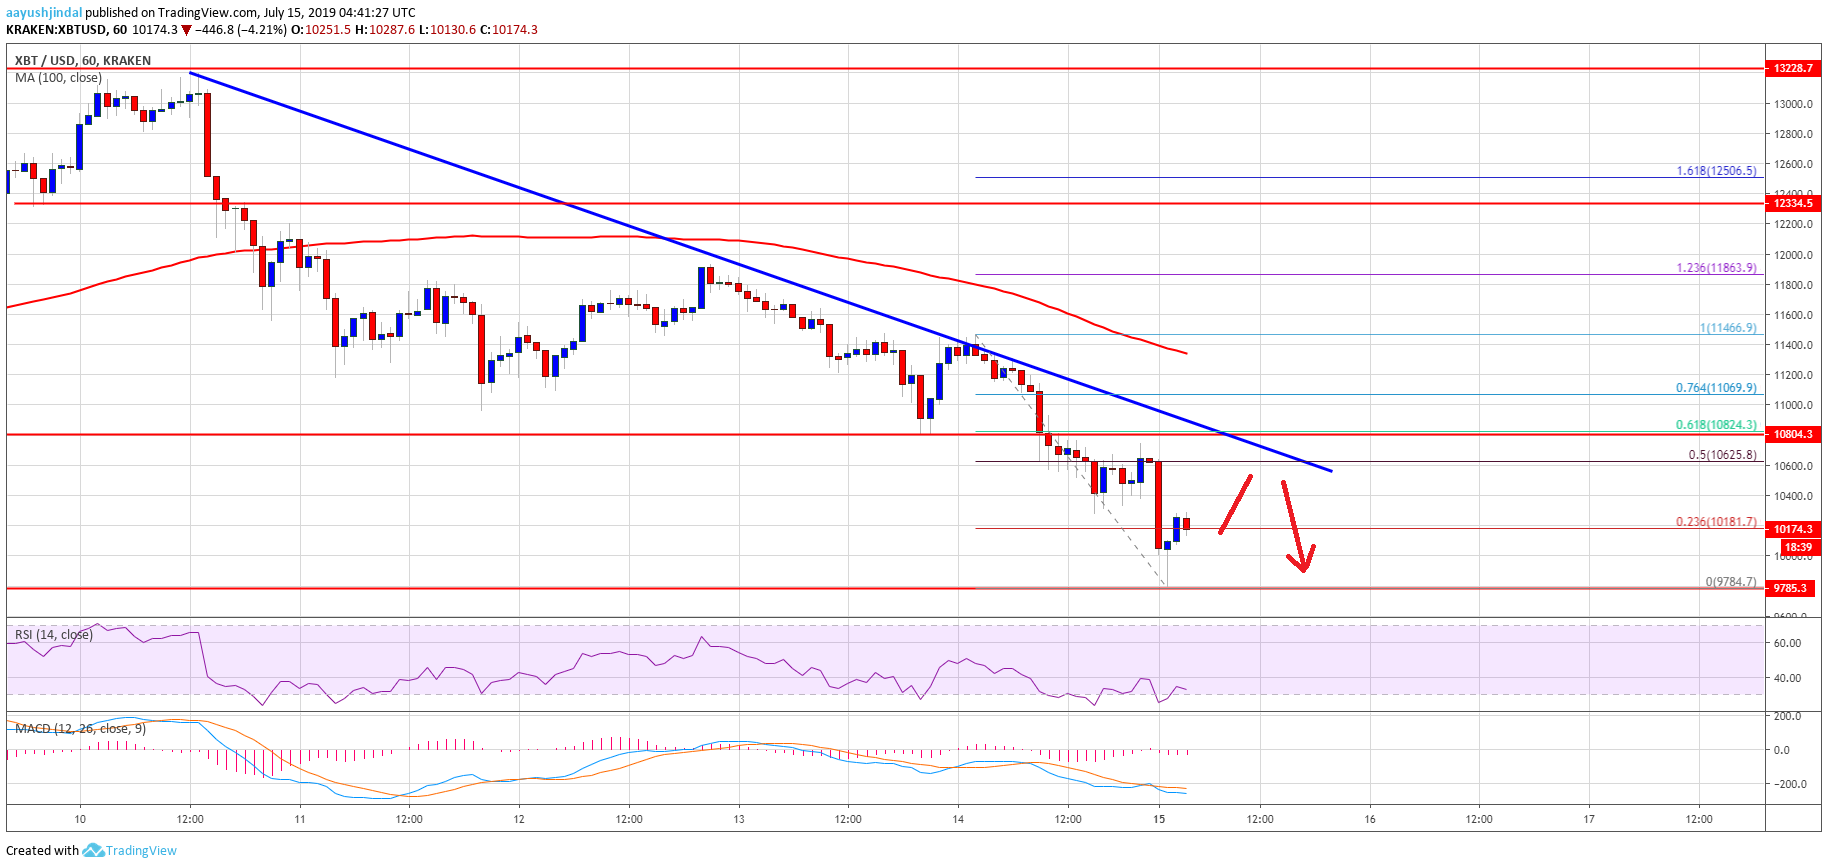
- Bitcoin price extended its declined and broke the key $10,800 support level against the US Dollar.
- The price even broke the last swing low and a major support area near the $10,500 level.
- There is a key bearish trend line forming with resistance near $10,650 on the hourly chart of the BTC/USD pair (data feed from Kraken).
- The price remains in a strong target and it seems like the $8,880 bearish target seems real.
Bitcoin price started a fresh decline below the $10,800 support against the US Dollar. BTC is currently correcting higher, but the $10,800 level is likely to act as a sell zone.
Bitcoin Price Analysis
In the past few days, there were heavy losses in bitcoin price below the $11,000 support against the US Dollar. The BTC/USD pair even broke the key $10,800 support area to extend its decline. Finally, there was a break below the last swing low and a major support area near the $10,500 level. The price settled below the $10,800 level and the 100 hourly simple moving average. A swing low was formed near the $9,784 level and the price is currently correcting higher.
More importantly, it seems like the $8,880 bearish target (as discussed in the weekly forecast) is now in sight. In the short term, there could be an upside correction above $10,200. The price is currently trading near the 23.6% Fib retracement level of the recent drop from the $11,466 high to $9,785 low. However, there are many resistance levels on the upside near the $10,500 and $10,600 levels.
Moreover, there is a key bearish trend line forming with resistance near $10,650 on the hourly chart of the BTC/USD pair. The 50% Fib retracement level of the recent drop from the $11,466 high to $9,785 low is just below the trend line. The main resistance is near the $10,800 level (the previous support area). To start a strong recovery, the price must settle above $10,800 level.
On the downside, an immediate support is near the $10,000 level, below which the price may retest the $9,780 level in the near term. If there are more losses, the price may continue to slide towards $9,500 and $9,200.
Looking at the chart, bitcoin price is clearly in a downtrend from the $13,200 yearly swing high. If the bears remain in action, it seems like the $8,880 bearish target (as discussed in the weekly forecast) could be test in the coming days.
Technical indicators:
Hourly MACD – The MACD is likely to move back in the bullish zone.
Hourly RSI (Relative Strength Index) – The RSI for BTC/USD is still well below the 40 level.
Major Support Levels – $10,000 followed by $9,750.
Major Resistance Levels – $10,500, $10,620 and $10,800.


