
Reason to trust
How Our News is Made
Strict editorial policy that focuses on accuracy, relevance, and impartiality
Ad discliamer
Morbi pretium leo et nisl aliquam mollis. Quisque arcu lorem, ultricies quis pellentesque nec, ullamcorper eu odio.
- ETH price remained in a bearish zone after it settled below the $280 support against the US Dollar.
- The price declined heavily and recently tested the key support area near the $260 level.
- There is a crucial bearish trend line forming with resistance near $282 on the 4-hours chart of ETH/USD (data feed via Kraken).
- The pair is likely to recover as long as it is trading above the key $260 support area.
Ethereum price is struggling to recover after a massive decline against the US Dollar and bitcoin. ETH price could start a decent upside correction once it breaks $272 and $282.
Ethereum Price Weekly Analysis
This past week, there were sharp losses in bitcoin and Ethereum against the US Dollar. The ETH/USD pair failed to hold gains and declined below the key $285 and $280 support levels. Moreover, there was a close below the $280 support and the 100 simple moving average (4-hours). The price even broke the $270 support area and tested the next key support area near the $260 level.
In the past two days, there were two attempts to break the $260 support, but sellers struggled to gain strength. At the moment, the price is consolidating above $260 and is trading inside a contracting triangle with resistance near the $272 level. The 23.6% Fib retracement level of the downward move from the $319 high to $260 low is also near the $274 level to act as a resistance. However, the main resistance on the upside is near the $280 and $284 levels.
Moreover, there is a crucial bearish trend line forming with resistance near $282 on the 4-hours chart of ETH/USD. Above the trend line, sellers might put up a fight near the $290 level and the 100 simple moving average (4-hours). Additionally, the 50% Fib retracement level of the downward move from the $319 high to $260 low is near the $290 level. Therefore, an upside break above $282 and $290 won’t be easy.
On the downside, the main support is near the $260 level. If there is a downside break below the $260 support, the price is likely to accelerate losses below the $250 level in the coming days.
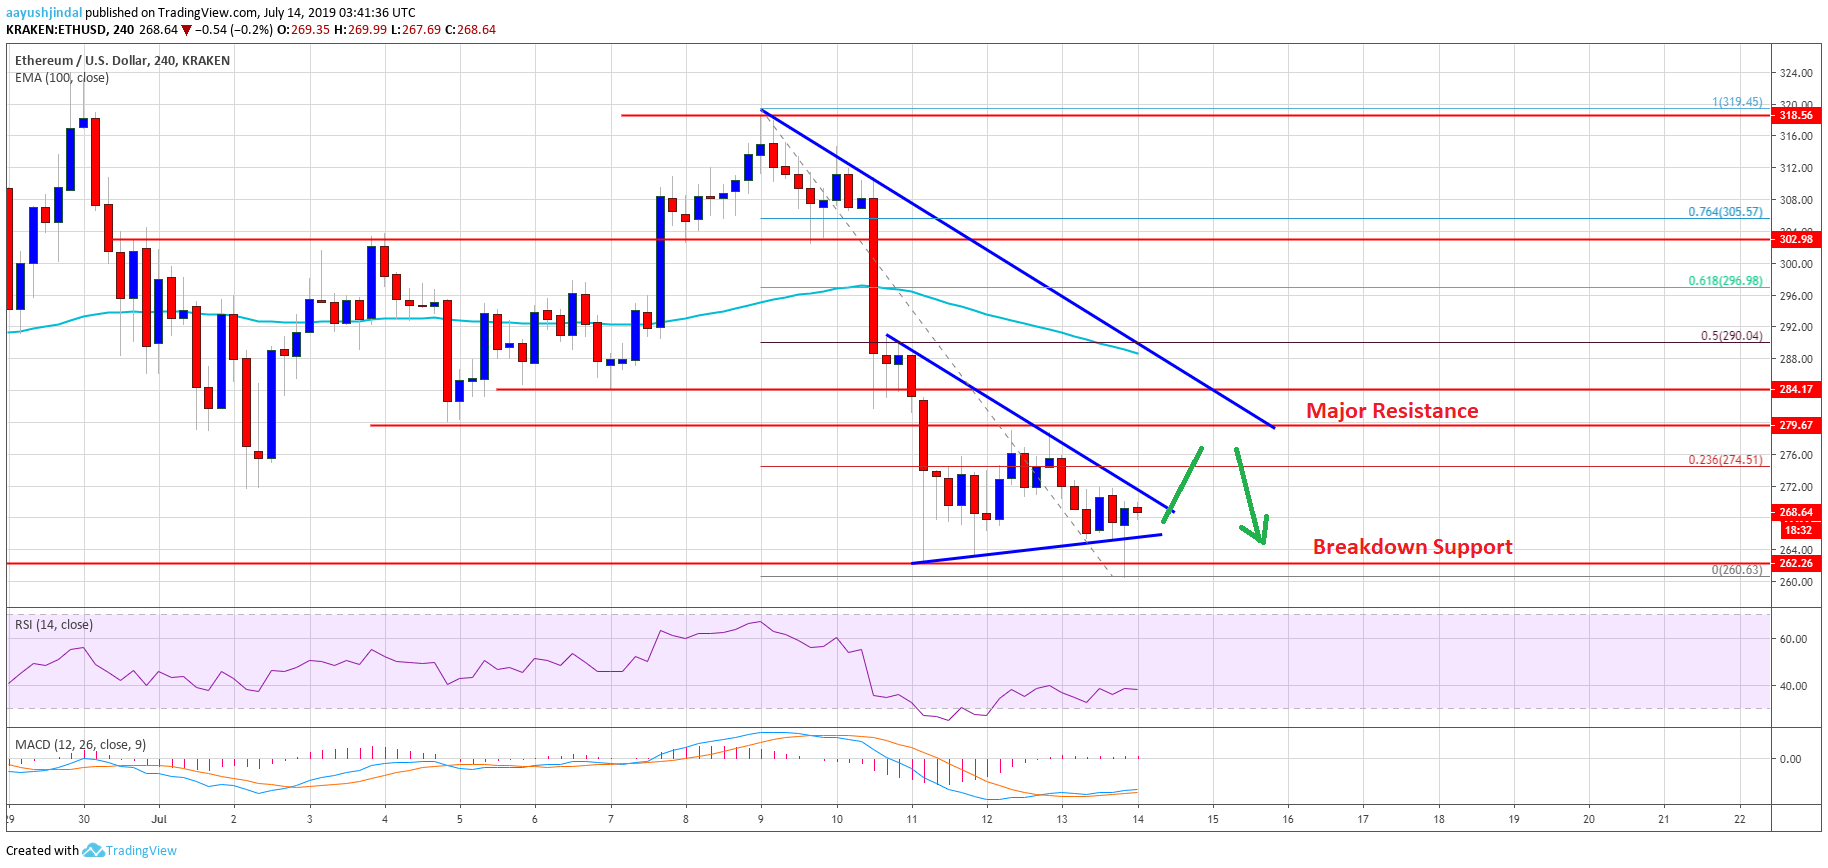
The above chart indicates that Ethereum price is holding the main support near $260. As long as there is no daily close below $260, there are chances of a decent recovery towards the $282 and $290 levels.
Technical Indicators
4 hours MACD – The MACD for ETH/USD is slowly losing pace in the bearish zone.
4 hours RSI – The RSI for ETH/USD is currently recovering above 30 and it may test the 50 level.
Major Support Level – $260
Major Resistance Level – $282


