
Reason to trust
How Our News is Made
Strict editorial policy that focuses on accuracy, relevance, and impartiality
Ad discliamer
Morbi pretium leo et nisl aliquam mollis. Quisque arcu lorem, ultricies quis pellentesque nec, ullamcorper eu odio.
- Ripple price declined heavily below the $0.3800 and $0.3500 support levels against the US dollar.
- The price even traded close to the $0.3000 support level and it is currently correcting higher.
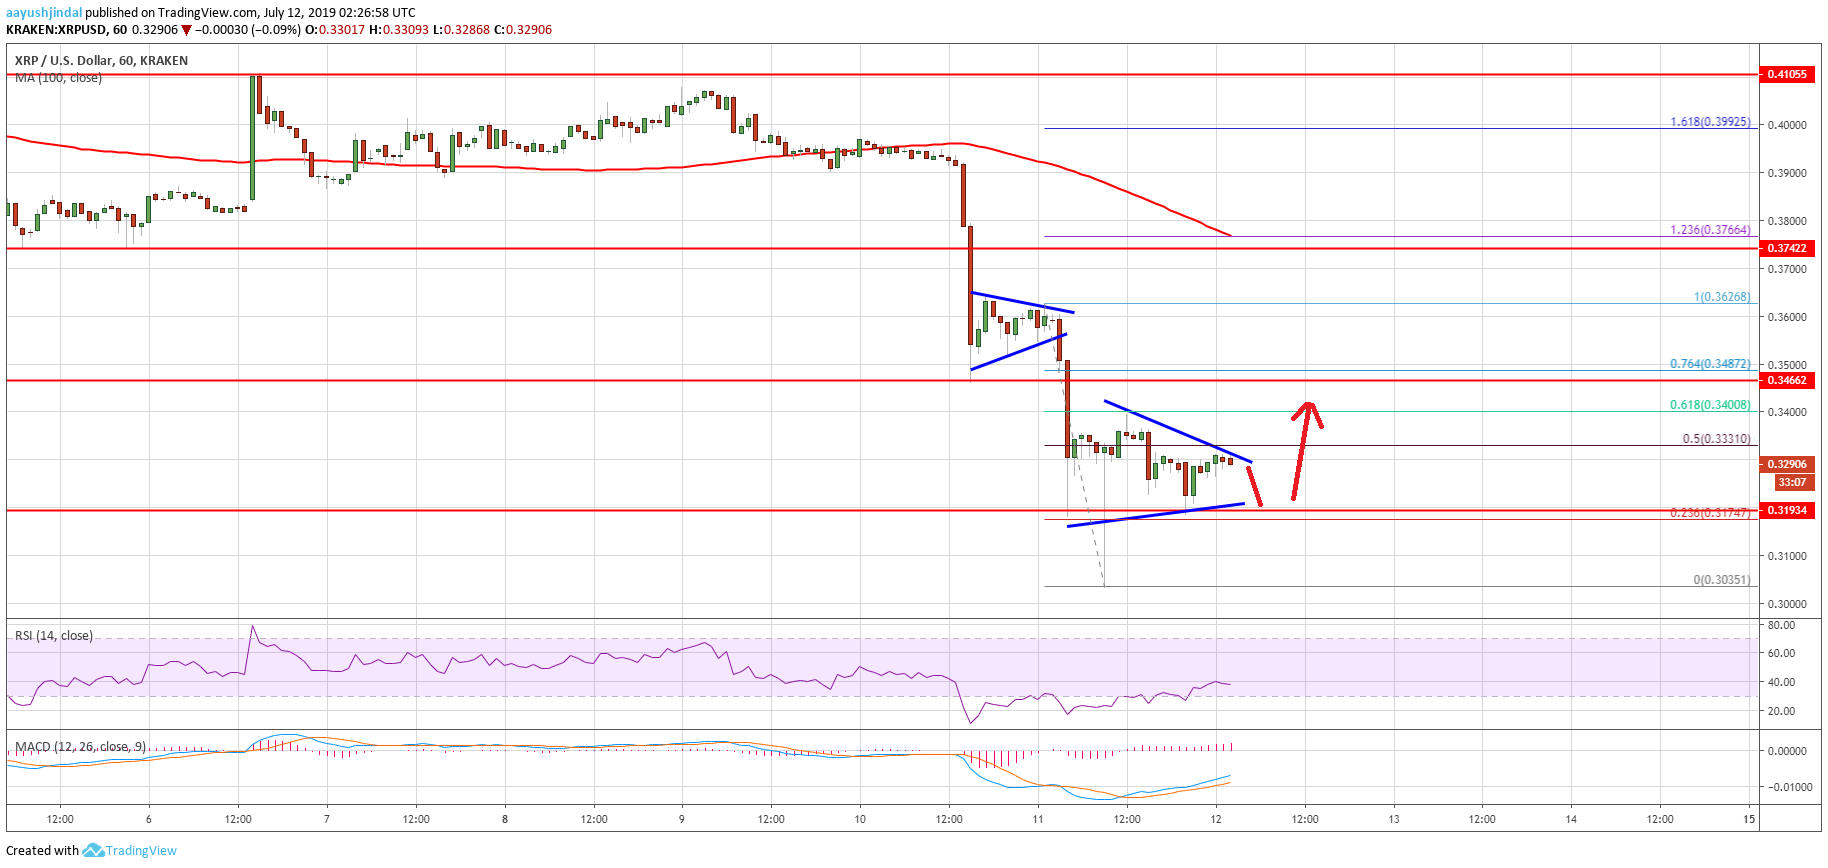
- There is a new breakout pattern forming with resistance near $0.3320 on the hourly chart of the XRP/USD pair (data source from Kraken).
- The price could correct higher, but upsides are likely to remain capped near $0.3460.
Ripple price is currently under a lot of pressure against the US Dollar and bitcoin. XRP price might recover towards the $0.3460 level, but later it could resume its slide.
Ripple Price Analysis
Recently, there was a sharp decline in bitcoin, Ethereum and ripple against the US Dollar. XRP/USD declined heavily below the $0.3800 and $0.3500 support levels. It opened the doors for more losses below the $0.3460 support level. Moreover, the price even broke the $0.3200 support and the 100 hourly simple moving average. Finally, the price traded close to the $0.3000 level and a new monthly low was formed near the $0.3035.
Recently, there was an upside correction above the $0.3150 and $0.3200 levels. The price climbed above the 50% Fib retracement level of the recent decline from the $0.3626 high to $0.3035 low. However, the upward move was capped by the $0.3400 level. Besides, there is a new breakout pattern forming with resistance near $0.3320 on the hourly chart of the XRP/USD pair.
The 61.8% Fib retracement level of the recent decline from the $0.3626 high to $0.3035 low also acted as a hurdle recently. It seems like ripple price might correct higher above the $0.3320 resistance area. However, the bulls are likely to face a strong resistance near the $0.3400 or $0.3460 level. The main resistance on the upside is near the $0.3750 level and the 100 hourly simple moving average.
On the other hand, if the price fails to correct above $0.3400 or $0.3460, there could be a fresh decline. An immediate support is near the $0.3180 level. If there is a downside break below $0.3180, the price is likely to revisit the $0.3030 or $0.3000 level.
Looking at the chart, ripple price is currently consolidating losses above the $0.3200 level. It may correct higher above $0.3320 or $0.3350. Having said that, the bulls are likely to struggle and the price could resume it slide if there is no successful break above the $0.4460 resistance area.
Technical Indicators
Hourly MACD – The MACD for XRP/USD is slowly moving in the bullish zone.
Hourly RSI (Relative Strength Index) – The RSI for XRP/USD recovered recently, but failed near the 40 level.
Major Support Levels – $0.3200, $0.3180 and $0.3030.
Major Resistance Levels – $0.3320, $0.3400 and $0.3460.