
Reason to trust
How Our News is Made
Strict editorial policy that focuses on accuracy, relevance, and impartiality
Ad discliamer
Morbi pretium leo et nisl aliquam mollis. Quisque arcu lorem, ultricies quis pellentesque nec, ullamcorper eu odio.
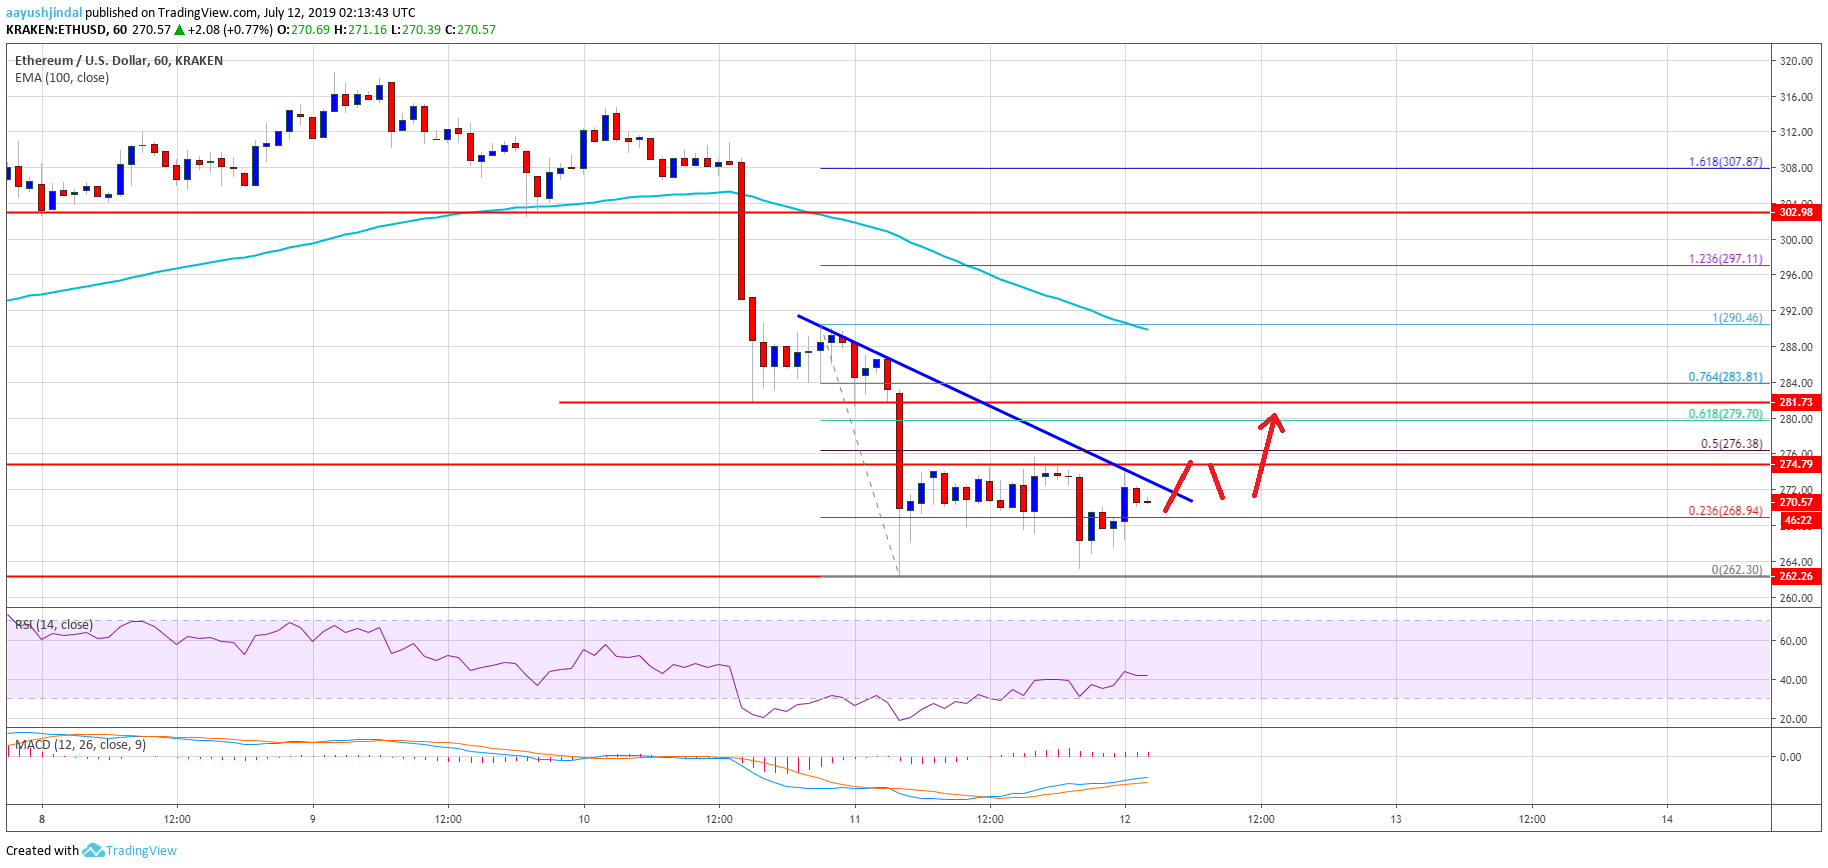
- ETH price declined heavily below the key $300 support area against the US Dollar.
- The price traded close to the $260 support level and it is currently consolidating losses.
- There is a short term bearish trend line forming with resistance near $274 on the hourly chart of ETH/USD (data feed via Kraken).
- The pair could correct higher in the near term, but it is likely to struggle near the $282 and $285 resistances.
Ethereum price started consolidating losses after a sharp dip versus the US Dollar and bitcoin. ETH price might correct higher towards $285 in the coming sessions.
Ethereum Price Analysis
Yesterday, we saw a massive drop in bitcoin, Ethereum, ripple and other major altcoins against the US Dollar. ETH/USD declined heavily below the key $300 support area and it even broke the $285 support. Moreover, there was a close below the $285 level and the 100 hourly simple moving average. The price traded close to the $262 level and recently started consolidating losses.
It corrected above the $270 level plus the 23.6% Fib retracement level of the recent decline from the $290 high to $262 swing low. However, the upward move was capped by the $275-276 area. Moreover, there is a short term bearish trend line forming with resistance near $274 on the hourly chart of ETH/USD. The 50% Fib retracement level of the recent decline from the $290 high to $262 swing low is also acting as a resistance.
The current price action suggests that the price is forming a support base for a short term correction above $275. If it clears the trend line, the next stop for the bulls could be near the $280-282 zone. The 61.8% Fib retracement level of the recent decline from the $290 high to $262 swing low is also likely to act as a resistance. To start a fresh increase, the price must settle above the $285 resistance.
Conversely, if there is no upside break above $275 or $280, the price could extend losses. An initial support is near the $262 level, below which the price is likely to break the $260 support level. The next major support is near the $250 level.
Looking at the chart, Ethereum price seems to be consolidating losses above $262 and it might correct higher. Having said that, the price is likely to face a strong resistance near the $280 or $285 level in the near term.
ETH Technical Indicators
Hourly MACD – The MACD for ETH/USD is currently placed in the bullish zone.
Hourly RSI – The RSI for ETH/USD is slowly moving higher, but it is still well below the 50 level.
Major Support Level – $262
Major Resistance Level – $280


