
Reason to trust
How Our News is Made
Strict editorial policy that focuses on accuracy, relevance, and impartiality
Ad discliamer
Morbi pretium leo et nisl aliquam mollis. Quisque arcu lorem, ultricies quis pellentesque nec, ullamcorper eu odio.
- Bitcoin price declined sharply below the $12,000 support area against the US Dollar.
- The price traded close to the $11,000 support and it is currently consolidating losses.
- There is a key bearish trend line forming with resistance near $11,400 on the hourly chart of the BTC/USD pair (data feed from Kraken).
- The price could either recover above $11,400 or it might extend losses below the $11,000 support.
Bitcoin price reached the key $11,000 support area against the US Dollar. BTC is currently consolidating and seems to be preparing for the next move either above $11,400 or towards $10,800.
Bitcoin Price Analysis
Yesterday, we saw a sharp decline in bitcoin price below the $12,000 support against the US Dollar. The BTC/USD pair even settled below the $12,000 support area and the 100 hourly simple moving average. Moreover, there was a break below the $11,800 support and the $11,500 pivot level. The price traded close to the $11,000 support and formed a new weekly low at $10,958. Similarly, there were heavy losses in Ethereum, BCH and ripple.
Recently, there was an upside correction above the $11,200 level. Moreover, the price broke the 50% Fib retracement level of the recent decline from the $11,829 high to $10,958 low. However, the upward move was capped by the $11,500 resistance level. The 61.8% Fib retracement level of the recent decline from the $11,829 high to $10,958 low also acted as a resistance.
At the outset, the price is consolidating losses above the $11,000 support level. On the upside, there is a key bearish trend line forming with resistance near $11,400 on the hourly chart of the BTC/USD pair. If there is an upside break above $11,400 and $11,500, bitcoin price could recover towards the $11,650 and $11,700 levels. However, the main resistance for the bulls is near the $11,800 level (the previous support).
Conversely, there could be more losses if there is no break above $11,400 and $11,500. The main supports on the downside are near $11,000 and $10,800. If there is a downside break below $10,800, the price may accelerate decline towards the $10,000 level.
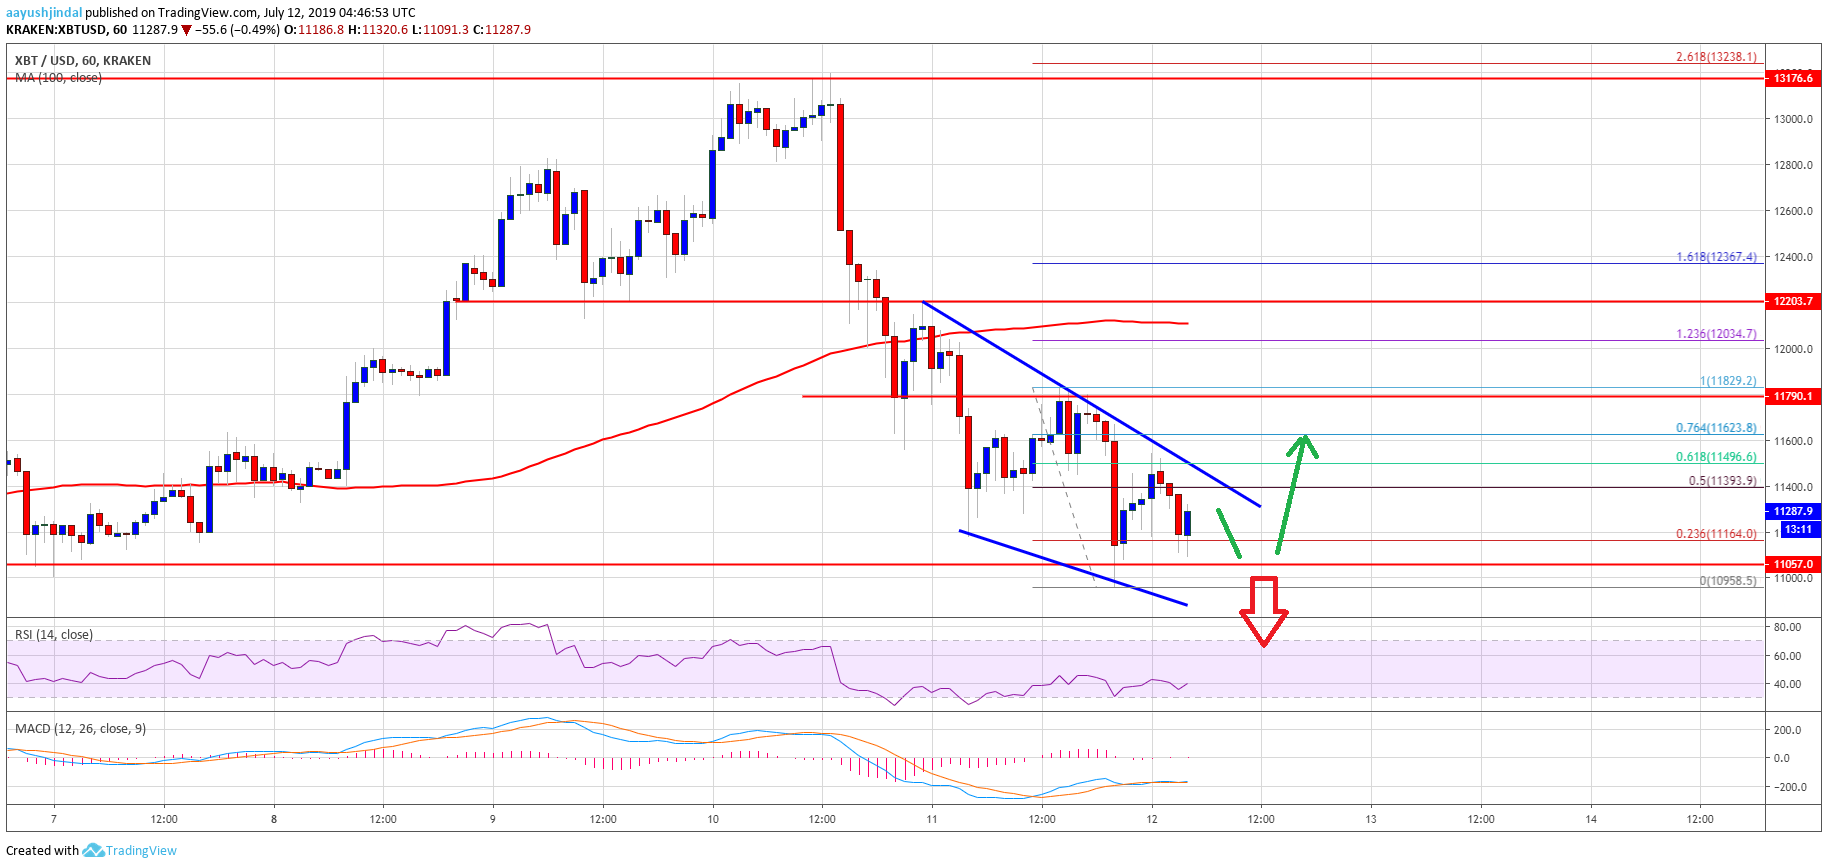
Looking at the chart, bitcoin price seems to be preparing for the next move either above the $11,400 level or below the $11,000 support. As long as the price is trading above the key $10,800 support, there are chances of an upside correction above $11,500.
Technical indicators:
Hourly MACD – The MACD is slowly moving back in the bearish zone.
Hourly RSI (Relative Strength Index) – The RSI for BTC/USD is currently recovering and it could test the 45 level.
Major Support Levels – $11,000 followed by $10,800.
Major Resistance Levels – $11,400, $11,500 and $11,800.