
Reason to trust
How Our News is Made
Strict editorial policy that focuses on accuracy, relevance, and impartiality
Ad discliamer
Morbi pretium leo et nisl aliquam mollis. Quisque arcu lorem, ultricies quis pellentesque nec, ullamcorper eu odio.
- Ripple price started a major decline after it failed to stay above the $0.4000 support against the US dollar.
- The price declined heavily and broke the $0.3850 and $0.3750 support levels.
- There is a new connecting bearish trend line forming with resistance near $0.3850 on the hourly chart of the XRP/USD pair (data source from Kraken).
- The price is currently consolidating and remains at a risk of more losses below $0.3500.
Ripple price declined sharply below $0.3750 against the US Dollar and down around 10% similar to bitcoin. XRP price may slide further if it fails to stay above $0.3450.
Ripple Price Analysis
Bitcoin price started a major decline from well above $13,000 and traded below the $12,000 support. It sparked bearish moves in ripple price below the $0.4000 support area. As a result, there was a sharp decline in XRP/USD below the $0.3850 and $0.3750 support levels. Moreover, the price broke the $0.3600 support area and settled well below the 100 hourly simple moving average.
Finally, there was a break below the $0.3500 support and the price traded as low as $0.3461. At the moment, the price is consolidating losses above the $0.3500 level. It broke the 23.6% Fib retracement level of the recent decline from the $0.3968 high to $0.3461 low. Moreover, there is a contracting triangle forming with resistance at $0.3620 on the hourly chart of the XRP/USD pair.
If there is a downside break below the $0.3550 support, the price could resume its slide. In the mentioned case, the price may even break the $0.3500 and $0.3450 support levels. The next key support is near the $0.3400 level. Conversely, if there is an upside break, the price could recover towards the $0.3700 level. However, the price is likely to face resistance near $0.3700 or $0.3720.
The 50% Fib retracement level of the recent decline from the $0.3968 high to $0.3461 low is also near the $0.3710 level. Moreover, there is a new connecting bearish trend line forming with resistance near $0.3850 on the same chart. As long as the price is below the $0.3700 and $0.3800 levels, it remains at a risk of more losses.
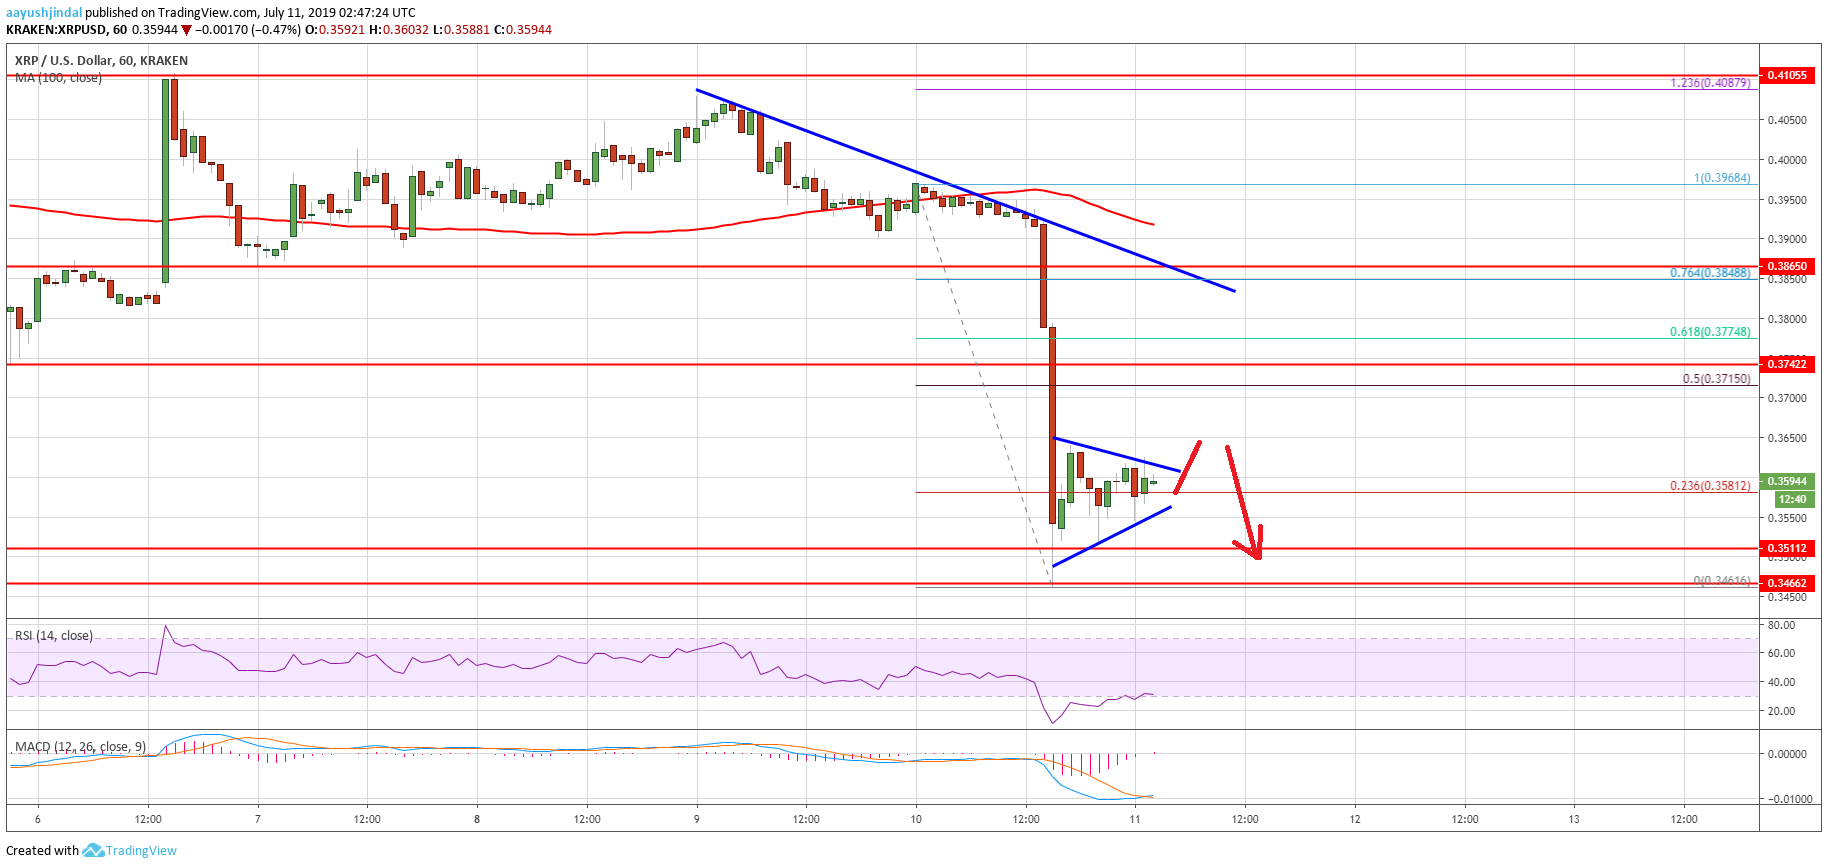
Looking at the chart, ripple price is clearly trading in a bearish zone below $0.3650 and $0.3700. It won’t be easy for the bulls to stage a recovery and the price is likely to extend losses below the $0.3500 support.
Technical Indicators
Hourly MACD – The MACD for XRP/USD is slowly losing momentum in the bearish zone.
Hourly RSI (Relative Strength Index) – The RSI for XRP/USD is currently recovering towards the 40 level.
Major Support Levels – $0.3550, $0.3500 and $0.3450.
Major Resistance Levels – $0.3650, $0.3700 and $0.3800.


