
Reason to trust
How Our News is Made
Strict editorial policy that focuses on accuracy, relevance, and impartiality
Ad discliamer
Morbi pretium leo et nisl aliquam mollis. Quisque arcu lorem, ultricies quis pellentesque nec, ullamcorper eu odio.
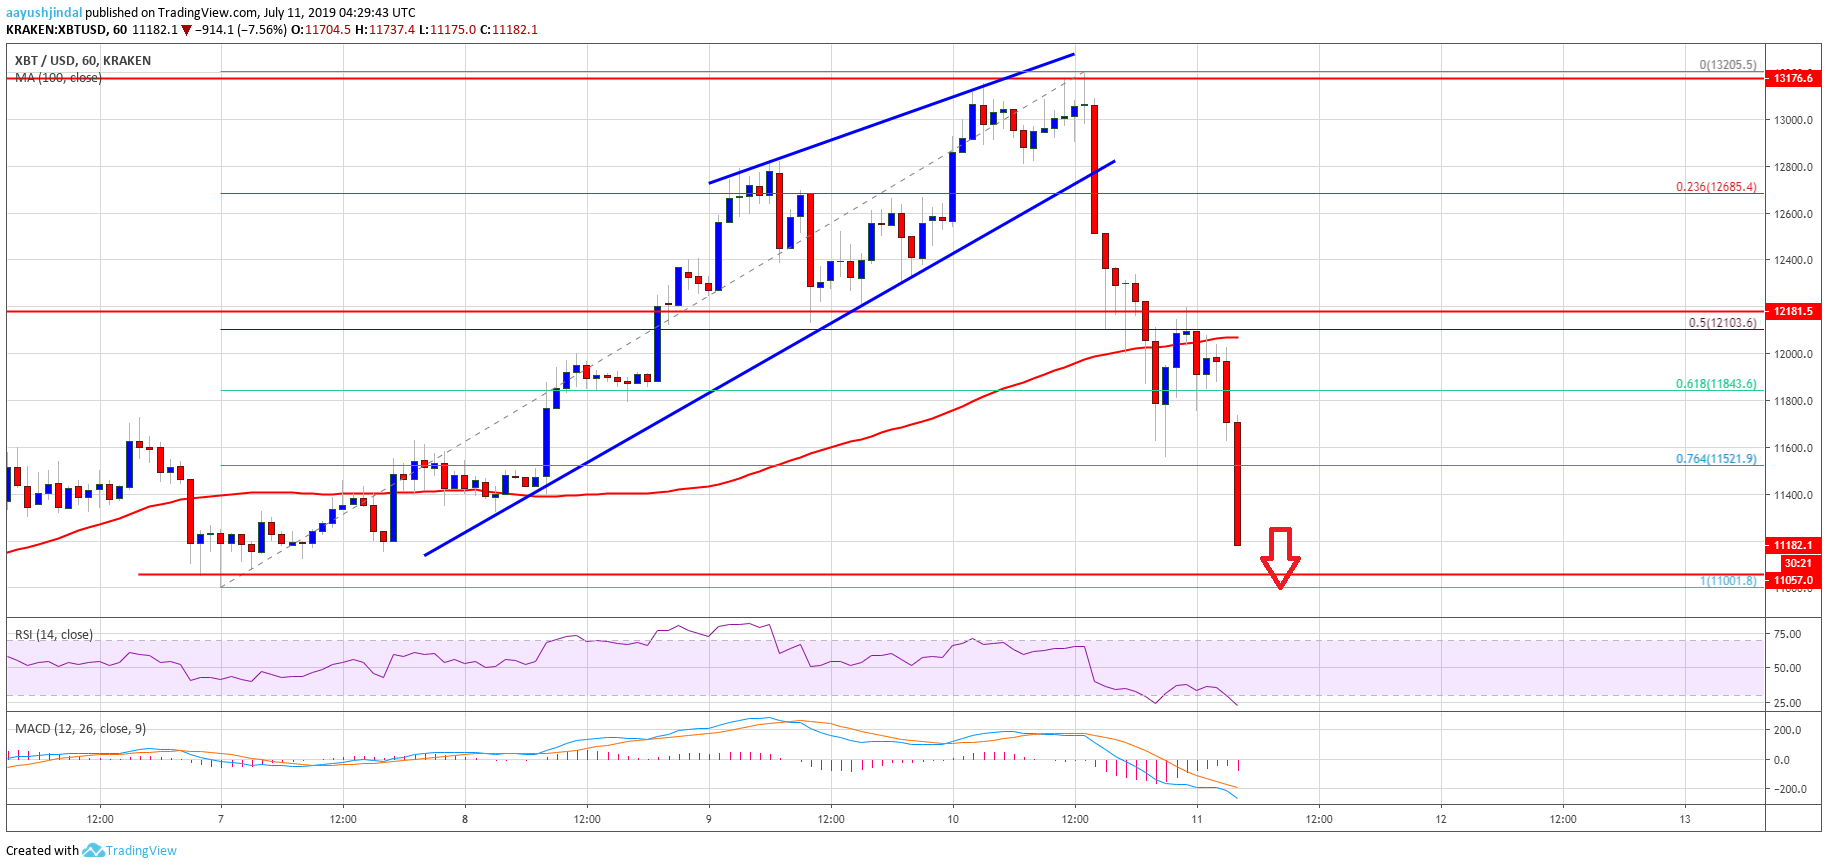
- Bitcoin price started a significant decline from the $13,200 swing high against the US Dollar.
- The price is down more than $2,000 and it even broke the $11,800 support area.
- There was a break below a major bullish trend line with support near $12,800 on the hourly chart of the BTC/USD pair (data feed from Kraken).
- The next important supports on the downside are near $11,000 and $10,800.
Bitcoin price nosedived by more than $2,000 from well above $13,000 against the US Dollar. BTC is now approaching the next important support near the $10,800 level.
Bitcoin Price Analysis
Yesterday, bitcoin price made a few attempts to settle above $13,000 against the US Dollar. However, the BTC/USD pair failed to gain momentum and recently started a sharp decline below $12,800 and $12,500. The recent decline was nasty, dragging Ethereum, BCH, LTC, ripple and the crypto market cap lower significantly. BTC broke the $12,000 and $11,800 support levels to move into a bearish zone.
Moreover, there was a break below a major bullish trend line with support near $12,800 on the hourly chart of the BTC/USD pair. The pair even settled below $11,500 and 100 hourly simple moving average. It is down more than 12% and broke the key $11,400 support as well. Moreover, there was a break below the 50% Fib retracement level of the last major move from the $11,001 low to $13,200 high.
It traded towards the $11,200 level and is trading with a bearish angle. Bitcoin is now trading well below the 76.4% Fib retracement level of the last major move from the $11,001 low to $13,200 high. Therefore, there are chances of more losses towards the $11,000 support area. The main support is near the $10,800 level, below which there is a risk of a drop towards the $10,500 level.
On the upside, an initial resistance is near the $11,500 level. If there is an upside correction, the price is likely to find hurdles near the $11,800 and $12,000 levels. The 100 hourly simple moving average is also likely to act as a strong barrier for the bulls near $12,000.
Looking at the chart, bitcoin price clearly trimmed most its recent gains and settled below $12,000. It could find bids near the $11,000 or $10,800 level and it may start consolidating losses. Besides, there could be a short term upside correction towards $11,800 or even $12,000.
Technical indicators:
Hourly MACD – The MACD is currently gaining pace in the bearish zone.
Hourly RSI (Relative Strength Index) – The RSI for BTC/USD is currently well above the 40 level, with a bearish angle.
Major Support Levels – $11,000 followed by $10,800.
Major Resistance Levels – $11,500, $11,800 and $12,000.


