
Reason to trust
How Our News is Made
Strict editorial policy that focuses on accuracy, relevance, and impartiality
Ad discliamer
Morbi pretium leo et nisl aliquam mollis. Quisque arcu lorem, ultricies quis pellentesque nec, ullamcorper eu odio.
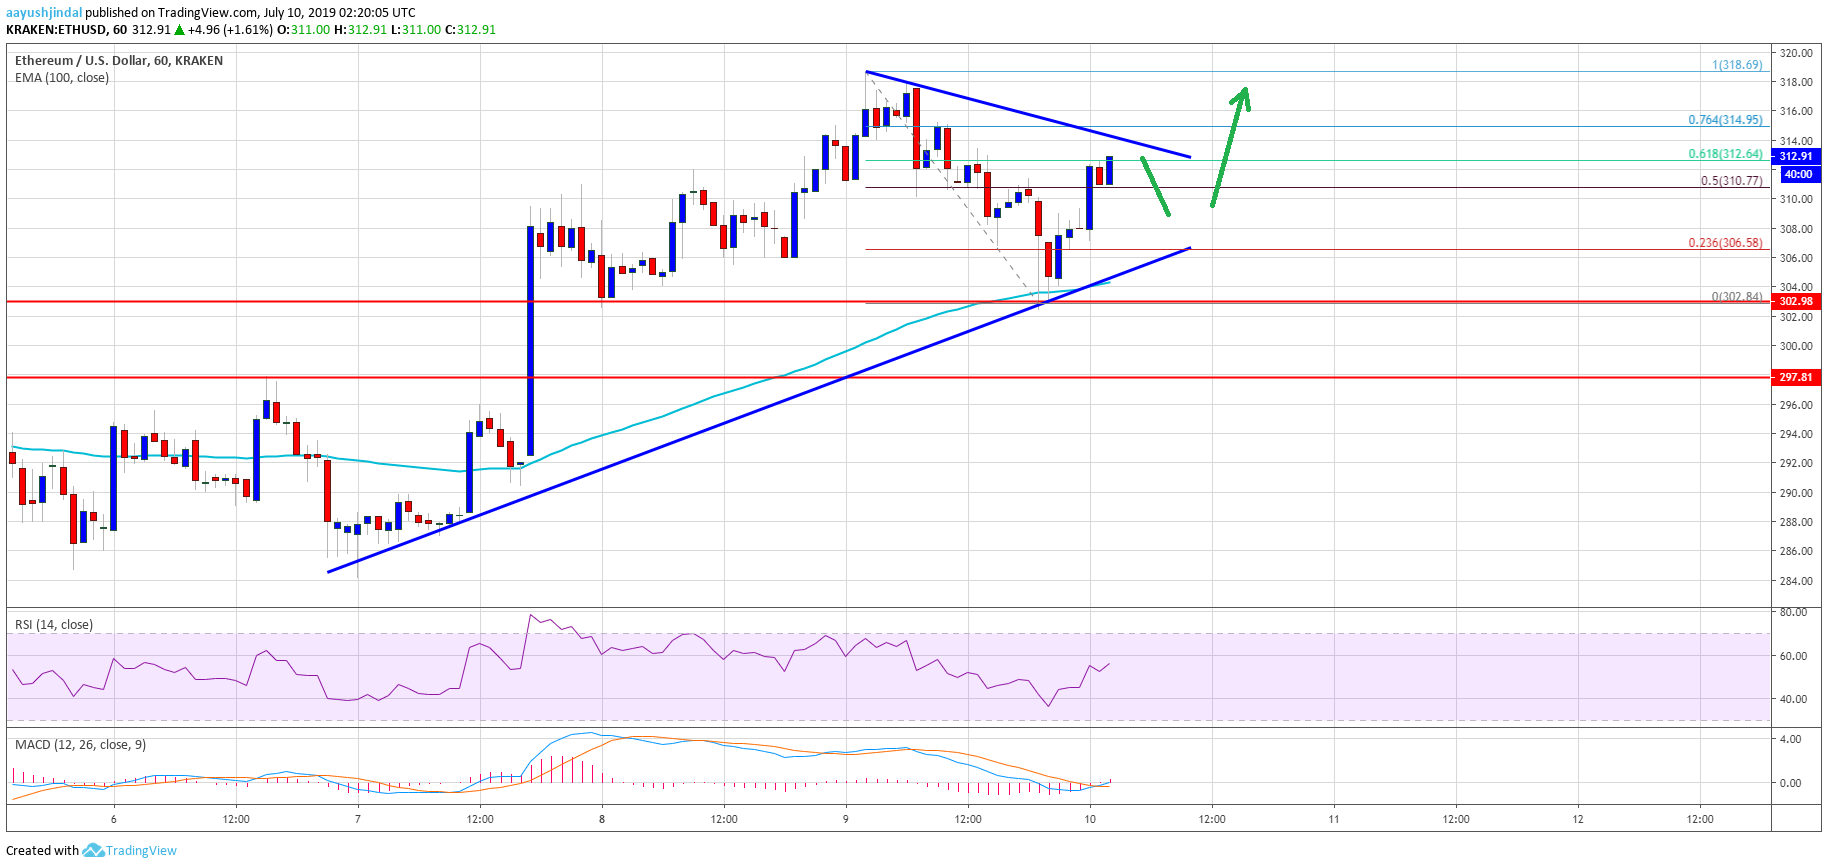
- ETH price is gaining momentum above the $310 resistance area against the US Dollar.
- The price must break the $315 resistance area to climb above the $320 resistance zone.
- There is a breakout pattern forming with resistance near $314 on the hourly chart of ETH/USD (data feed via Kraken).
- On the downside, there are a few important supports near the $306 and $302 levels.
Ethereum price is likely to break the $320 resistance area versus the US Dollar, but struggled vs bitcoin. ETH price remains well supported on the downside as long as above $302.
Ethereum Price Analysis
After yesterday’s rise, there were further gains in bitcoin price above $12,500 against the US Dollar. BTC/USD even broke the $13,000 resistance area (as discussed in yesterday’s analysis). On the other hand, there was no new weekly high in Ethereum, but it remained stable above the $300 and $302 support levels. Earlier, it started a downside correction from the $318 swing high and traded below the $310 support area.
However, the $302 support zone acted as a strong support along with the 100 hourly simple moving average. A swing low was formed at $302.80 and the price recently climbed back above the $306 and $308 levels. Moreover, it recovered above the 50% Fib retracement level of the recent decline from the $318 high to $302 swing low. It is now trading nicely above the $310 level.
Moreover, there is a breakout pattern forming with resistance near $314 on the hourly chart of ETH/USD. The pair is currently trading near the 61.8% Fib retracement level of the recent decline from the $318 high to $302 swing low. If there is an upside break above the $314 and $315 resistance levels, Ethereum price could continue to rise. In the mentioned case, the price is likely to break the last swing high near $318 and trade to a new weekly high above $320.
The next major resistance is near the $325 level. On the downside, an initial support is near the $310 level. The next major support is near the $306 level, which is near the triangle lower trend line.
Looking at the chart, Ethereum price is clearly trading with a positive bias above the $310 level and it looks set for more gains above the $315 and $320 levels. The bulls may even push the price above the $325 resistance level in the near term.
ETH Technical Indicators
Hourly MACD – The MACD for ETH/USD is moving back in the bullish zone, with a positive bias.
Hourly RSI – The RSI for ETH/USD is currently well above the 55 level, with a positive angle.
Major Support Level – $306
Major Resistance Level – $320