
Reason to trust
How Our News is Made
Strict editorial policy that focuses on accuracy, relevance, and impartiality
Ad discliamer
Morbi pretium leo et nisl aliquam mollis. Quisque arcu lorem, ultricies quis pellentesque nec, ullamcorper eu odio.
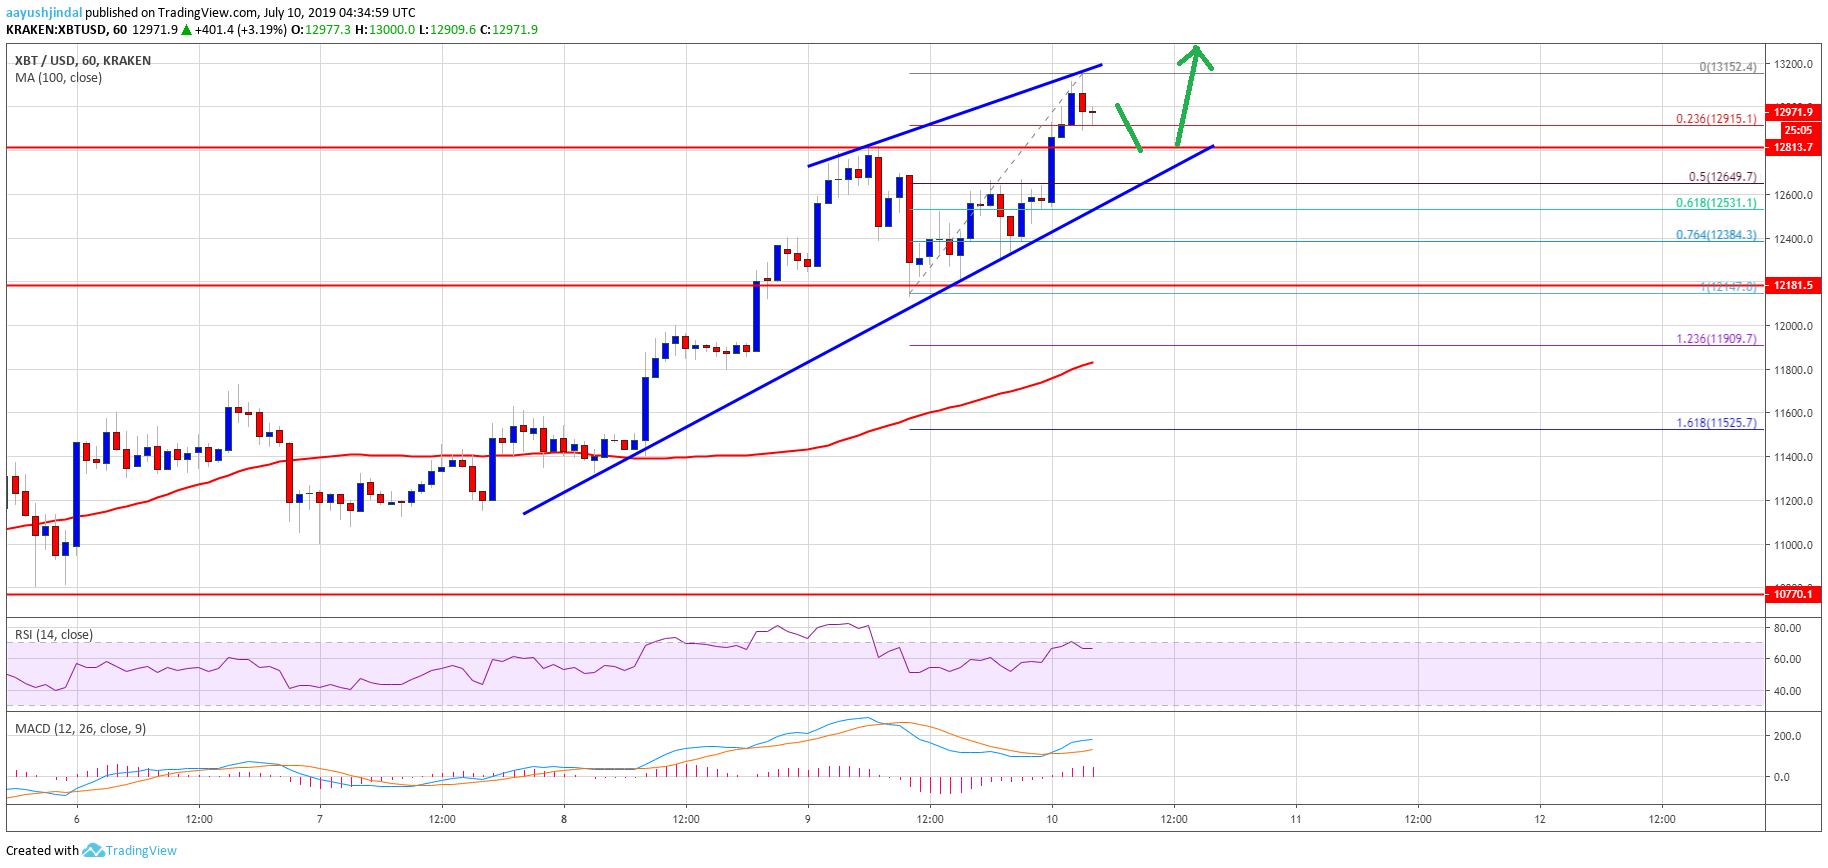
- There was an upside extension above the $12,800 and $13,000 resistances in bitcoin price against the US Dollar.
- The price even traded close the second bullish target of $13,200 (as discussed yesterday).
- There is a major bullish trend line forming with support near $12,700 on the hourly chart of the BTC/USD pair (data feed from Kraken).
- Dips remain supported if there is a downside correction towards the $12,700 or $12,500 level.
Bitcoin price climbed further higher and broke the key $13,000 resistance against the US Dollar. BTC is currently consolidating gains and it is likely to continue higher.
Bitcoin Price Analysis
Yesterday, we saw a solid upward move in bitcoin price above the $12,000 and $12,200 resistances against the US Dollar. Later, the BTC/USD pair corrected lower from the $12,800 resistance area. It traded below the $12,500 level and tested the $12,200 support area. The bulls remained in action and the price remained supported above $12,000. Moreover, there was no close below $12,000 and the 100 hourly simple moving average.
As a result, there was a fresh increase above the $12,500 resistance level. The price gained bullish momentum and broke the $13,000 level (target discussed in yesterday’s analysis). Besides, it traded close to the second bullish target of $13,200. A new weekly high was formed at $13,152 and bitcoin price is currently correcting gains. It is trading near the $12,900 level plus the 23.6% Fib retracement level of the recent wave from the $12,147 low to $13,152 high.
On the downside, there are many supports near the $12,800 and $12,600 levels. Moreover, there is a major bullish trend line forming with support near $12,700 on the hourly chart of the BTC/USD pair. The 50% Fib retracement level of the recent wave from the $12,147 low to $13,152 high is also near the $12,650 level to act as a strong support.
If there is a downside break below the $12,600 and $12,500 support levels, the price could revisit the $12,200 support area. On the upside, an initial resistance is near the $13,200 level, above which there are chances of a push towards the $13,500 level.
Looking at the chart, bitcoin price seems to be preparing for more upsides above the $13,200 level. In the short term, there could be a downside correction, but the bulls are likely to defend the $12,800 or $12,600 support area in the coming sessions.
Technical indicators:
Hourly MACD – The MACD is currently gaining pace in the bullish zone.
Hourly RSI (Relative Strength Index) – The RSI for BTC/USD is currently well above the 60 level, with positive signs.
Major Support Levels – $12,800 followed by $12,600.
Major Resistance Levels – $13,150, $13,200 and $13,500.


