
Reason to trust
How Our News is Made
Strict editorial policy that focuses on accuracy, relevance, and impartiality
Ad discliamer
Morbi pretium leo et nisl aliquam mollis. Quisque arcu lorem, ultricies quis pellentesque nec, ullamcorper eu odio.
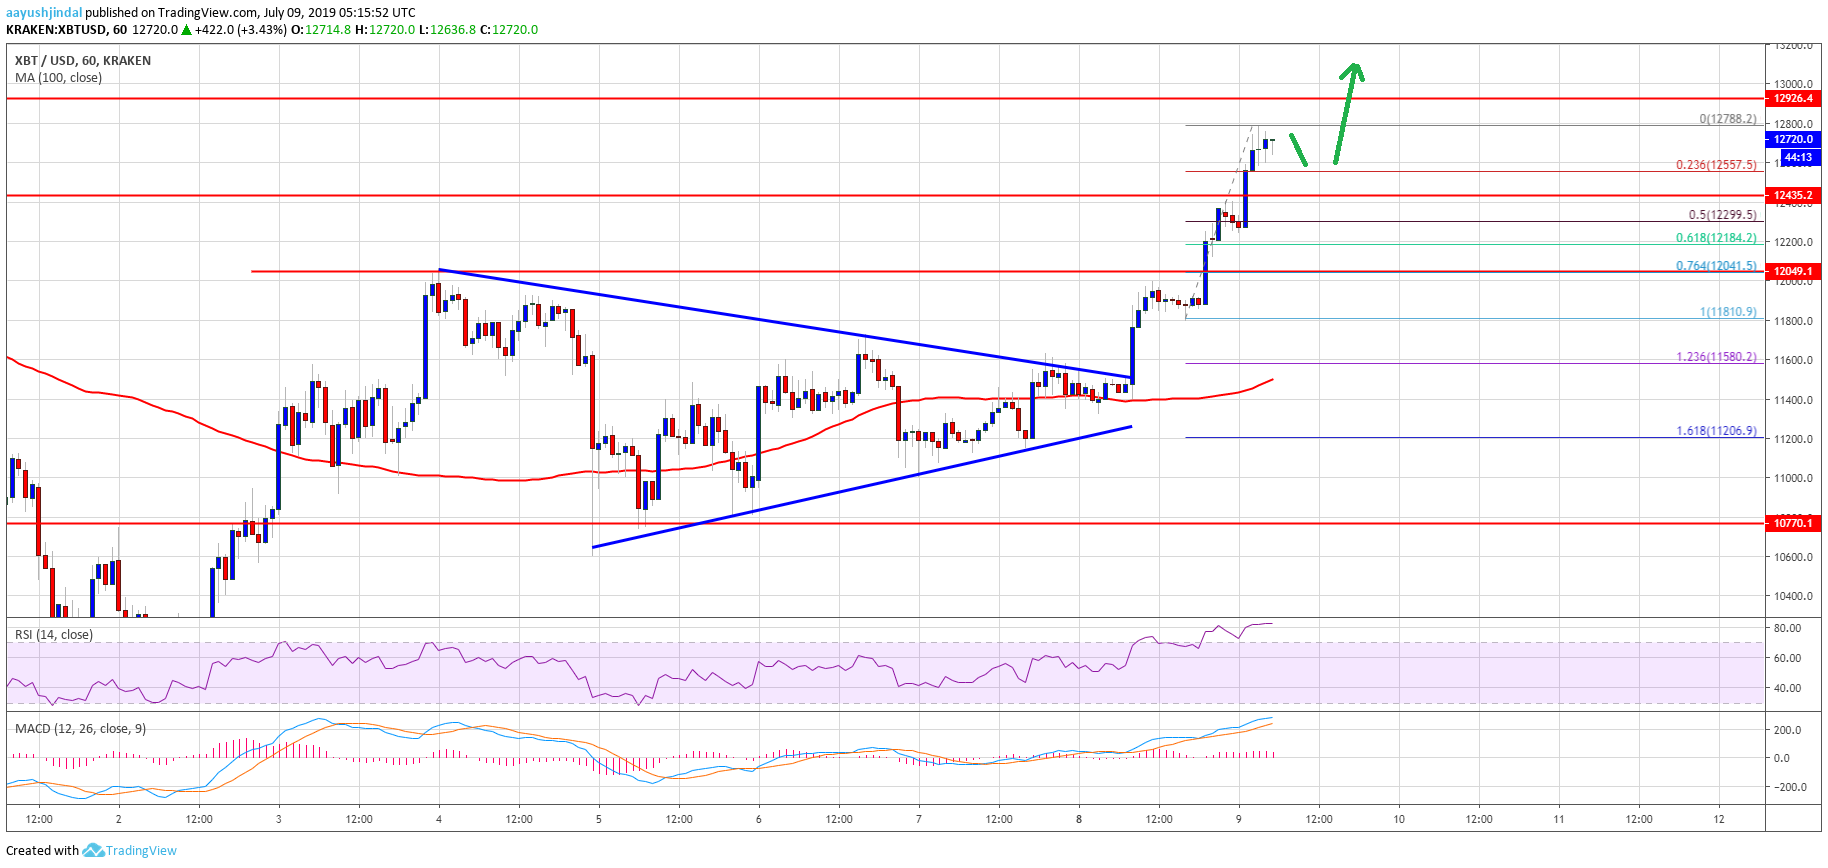
- There was a strong rise in bitcoin price above the $12,000 resistance level against the US Dollar.
- The price broke the last swing high and traded to a new weekly high above $12,700.
- Yesterday’s highlighted crucial contracting triangle was breached with resistance near $11,520 on the hourly chart of the BTC/USD pair (data feed from Kraken).
- The bulls are currently in control and it seems like they are eyeing $13,000 or even $13,200.
Bitcoin price climbed higher sharply above $12,000 and $12,500 against the US Dollar. BTC is currently showing positive signs and it could even test the $13,000 resistance.
Bitcoin Price Analysis
Yesterday, we saw a few positive moves in bitcoin price above the $11,000 level against the US Dollar. The BTC/USD pair traded steadily above the $11,200 pivot level and the 100 hourly simple moving average. Moreover, there were range moves before the price started a strong upward move above the $11,500 resistance level. Once there was a close above the $11,500 level, the climbed more than 12% in the past three sessions.
Moreover, yesterday’s highlighted crucial contracting triangle was breached with resistance near $11,520 on the hourly chart of the BTC/USD pair. It set the tone for a fresh rally above the $12,000 resistance level. The pair even broke the $12,500 resistance and traded close to the $12,800 level. A new weekly high was formed near $12,788 and the price is currently consolidating gains.
An initial support is near the $12,600 level plus the 23.6% Fib retracement level of the recent rally from the $11,810 low to $12,788 high. On the downside, there are many important supports near the $12,500 level. If there are more losses, the $12,250 level may act as a strong support. It coincides with the 50% Fib retracement level of the recent rally from the $11,810 low to $12,788 high.
On the upside, an initial resistance is near the $12,800 level. If there is an upside break, the price is likely to climb further above the $13,000 level. The next major resistance for the bulls is near the $13,200 level.
Looking at the chart, bitcoin price is clearly trading with a strong bullish bias above the $12,200 and $12,500 support levels. Therefore, there are high chances of more upsides above the $13,000 level in the coming sessions. Any decline from the current levels might find a strong support near $12,600 or $12,250.
Technical indicators:
Hourly MACD – The MACD is gaining momentum in the bullish zone.
Hourly RSI (Relative Strength Index) – The RSI for BTC/USD is currently near the extreme overbought levels.
Major Support Levels – $12,600 followed by $12,250.
Major Resistance Levels – $11,500, $11,600 and $12,000.


