
Reason to trust
How Our News is Made
Strict editorial policy that focuses on accuracy, relevance, and impartiality
Ad discliamer
Morbi pretium leo et nisl aliquam mollis. Quisque arcu lorem, ultricies quis pellentesque nec, ullamcorper eu odio.
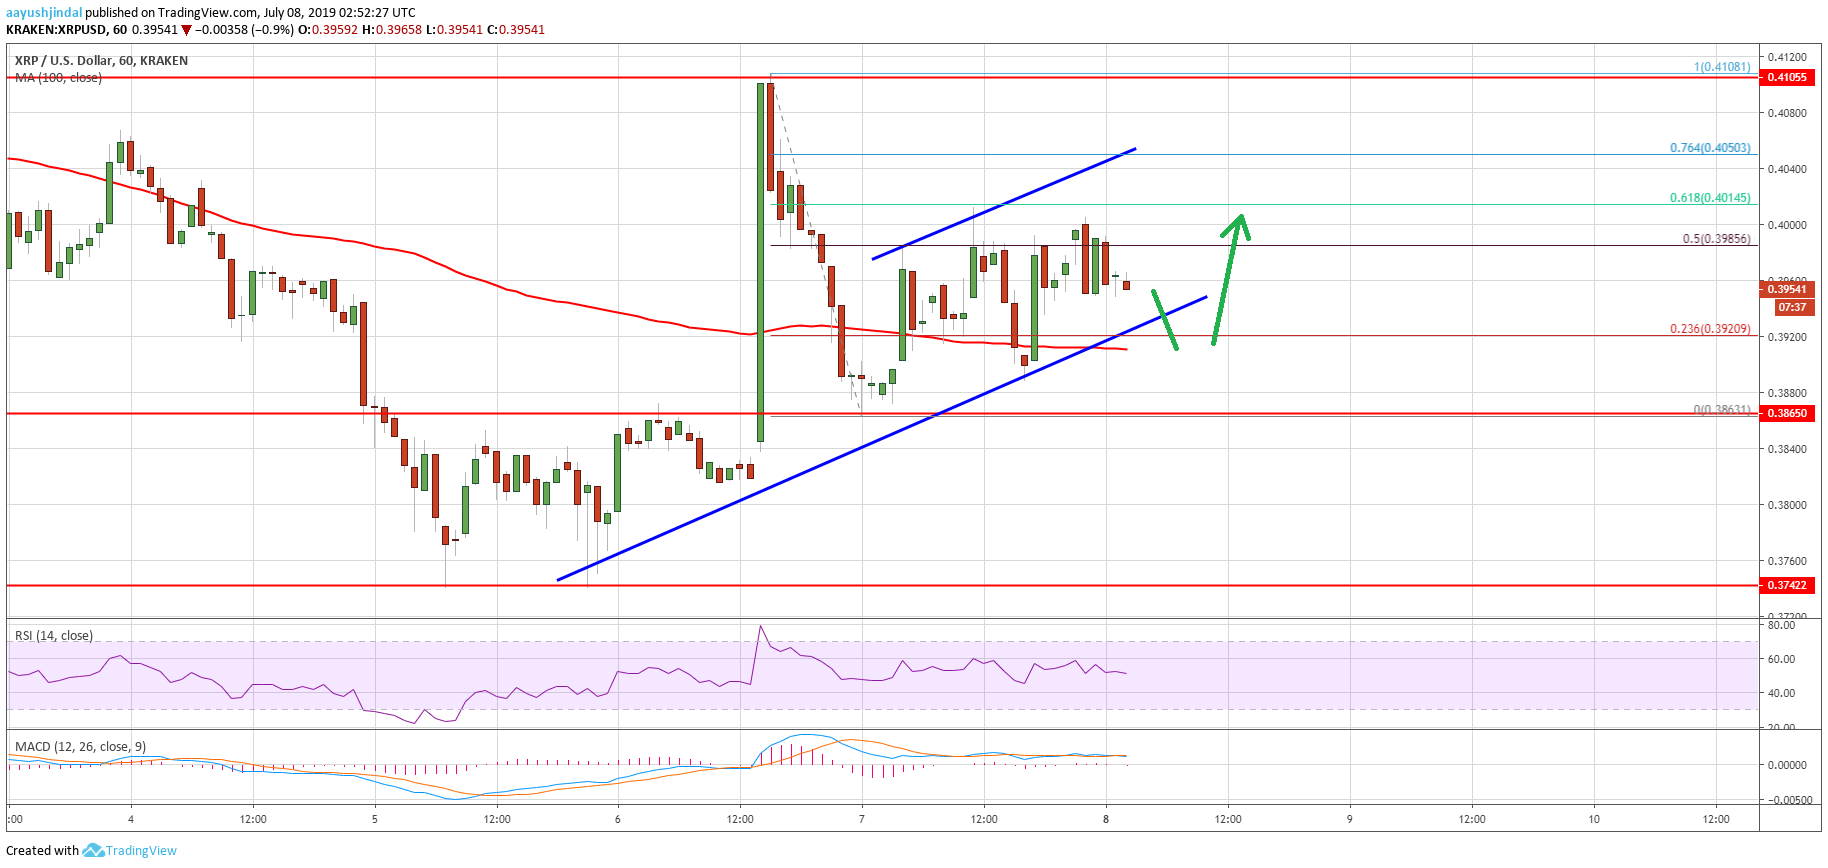
- Ripple price started a strong recovery above the $0.3900 level against the US dollar.
- The price even broke the $0.4000 level and it recently tested the $0.4100 resistance area.
- There is a key bullish trend line forming with support near $0.3920 on the hourly chart of the XRP/USD pair (data source from Kraken).
- The price is likely to bounce back above $0.4000 as long it is trading above the $0.3900 support.
Ripple price is showing a few positive signs above $0.3900 against the US Dollar, and recovered vs bitcoin. XRP price might dip a few points, but it is likely to find bids near $0.3900.
Ripple Price Analysis
Recently, bitcoin price settled above the $11,000 level and started trading in a range. However, ripple price started a decent upward move after it tested the $0.3750 support area against the US Dollar. The XRP/USD pair broke the $0.3900 resistance level to move into a positive zone. Moreover, there was a break above the $0.4000 resistance and the 100 hourly simple moving average. It even spiked above $0.4100 and formed a new swing high at $0.4108.
Recently, it started a downside correction below the $0.4000 and $0.3950 levels. Moreover, there was a break below the $0.3900 level, but the $0.3860 level acted as a support. The price bounce back above $0.3920 and the 100 hourly simple moving average. Moreover, there was a break above the 50% Fib retracement level of the recent decline from the $0.4108 high to $0.3863 low.
However, it seems like the $0.4000 level is acting as a resistance. Ripple price even failed to test the 61.8% Fib retracement level of the recent decline from the $0.4108 high to $0.3863 low. It is currently moving lower towards the $0.3920 support. Besides, there is a key bullish trend line forming with support near $0.3920 on the hourly chart of the XRP/USD pair.
If there is a downside break below the trend line and $0.3900, the price could revisit the $0.3860 support level. Should there be more losses, the next stop for sellers could be near the $0.3800 level. On the upside, an initial resistance is near the $0.4000 barrier, above which there could be more gains towards $0.4100.
Looking at the chart, ripple price is clearly trading with a positive bias, but it must stay above $0.3900 to continue higher towards $0.4100 in the near term.
Technical Indicators
Hourly MACD – The MACD for XRP/USD is slowly moving back in the bearish zone.
Hourly RSI (Relative Strength Index) – The RSI for XRP/USD is currently declining and it is just below the 50 level.
Major Support Levels – $0.3840, $0.3820 and $0.3750.
Major Resistance Levels – $0.3920, $0.3950 and $0.4000.


