
Reason to trust
How Our News is Made
Strict editorial policy that focuses on accuracy, relevance, and impartiality
Ad discliamer
Morbi pretium leo et nisl aliquam mollis. Quisque arcu lorem, ultricies quis pellentesque nec, ullamcorper eu odio.
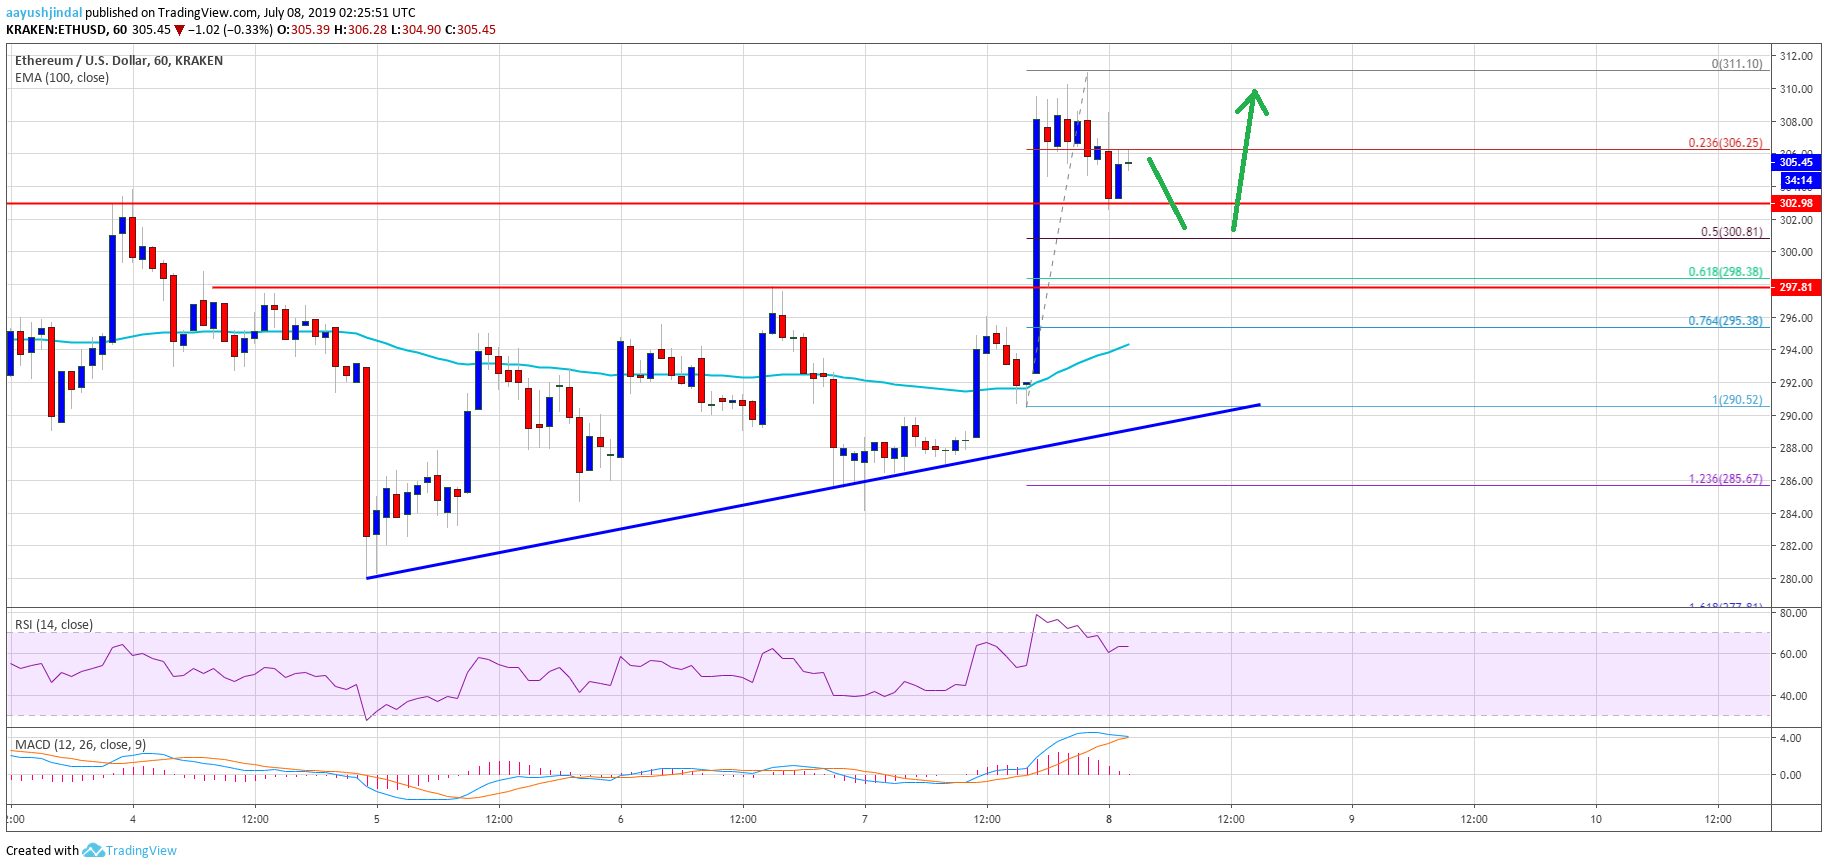
- ETH price started a decent recovery and broke the key $300 resistance area against the US Dollar.
- The price was able to settle above the $300 level and it recently tested the $310 resistance.
- There is a major bullish trend line forming with support near $292 on the hourly chart of ETH/USD (data feed via Kraken).
- If there is a downside correction, the price is likely to find support near $300 or $298.
Ethereum price is showing a lot of positive signs versus the US Dollar and bitcoin. ETH price is currently trading nicely above $300 and it could continue higher.
Ethereum Price Analysis
In the past few sessions, there was a slow and steady rise in Ethereum from the $286 swing low against the US Dollar. The ETH/USD pair formed a decent support base above the $285 level and recently traded above the $290 and $295 resistance levels. Moreover, there was a close above the $300 level and the 100 hourly simple moving average. It opened the doors for more gains above the $305 level.
A new weekly high was formed near $311 and the price is currently correcting lower. It broke the $305 level and the 23.6% Fib retracement level of the recent wave from the $290 low to $311 high. However, the recent decline seems limited, with supports near $302 and $300. At the outset, the $302 level is acting as a solid support. Moreover, the 50% Fib retracement level of the recent wave from the $290 low to $311 high is near the $300 level to act as a strong support.
More importantly, there is a major bullish trend line forming with support near $292 on the hourly chart of ETH/USD. The pair remains well supported on the downside near the $300, $295 and $292 levels. The 61.8% Fib retracement level of the recent wave from the $290 low to $311 high is also near $298. Therefore, dips remain well supported on the downside in the near term.
On the upside, if there is a break above the $308-310 resistance, the price could accelerate higher. The next major hurdle for the bulls is near the $308 level, above which the price could accelerate towards the $325 level.
Looking at the chart, Ethereum price is showing a lot of positive signs above $300 and it even outpaced bitcoin in the recent upward move. Once the current correction is complete, the price could rise above $310.
ETH Technical Indicators
Hourly MACD – The MACD for ETH/USD is currently reducing its bullish slope, with a few bearish signs.
Hourly RSI – The RSI for ETH/USD is currently correcting lower from the 80 level.
Major Support Level – $300
Major Resistance Level – $310