
Reason to trust
How Our News is Made
Strict editorial policy that focuses on accuracy, relevance, and impartiality
Ad discliamer
Morbi pretium leo et nisl aliquam mollis. Quisque arcu lorem, ultricies quis pellentesque nec, ullamcorper eu odio.
- After a downside correction, bitcoin price fond support near the $10,800 level against the US Dollar.
- There was a decent recovery in the past two sessions and the price traded above $11,300.
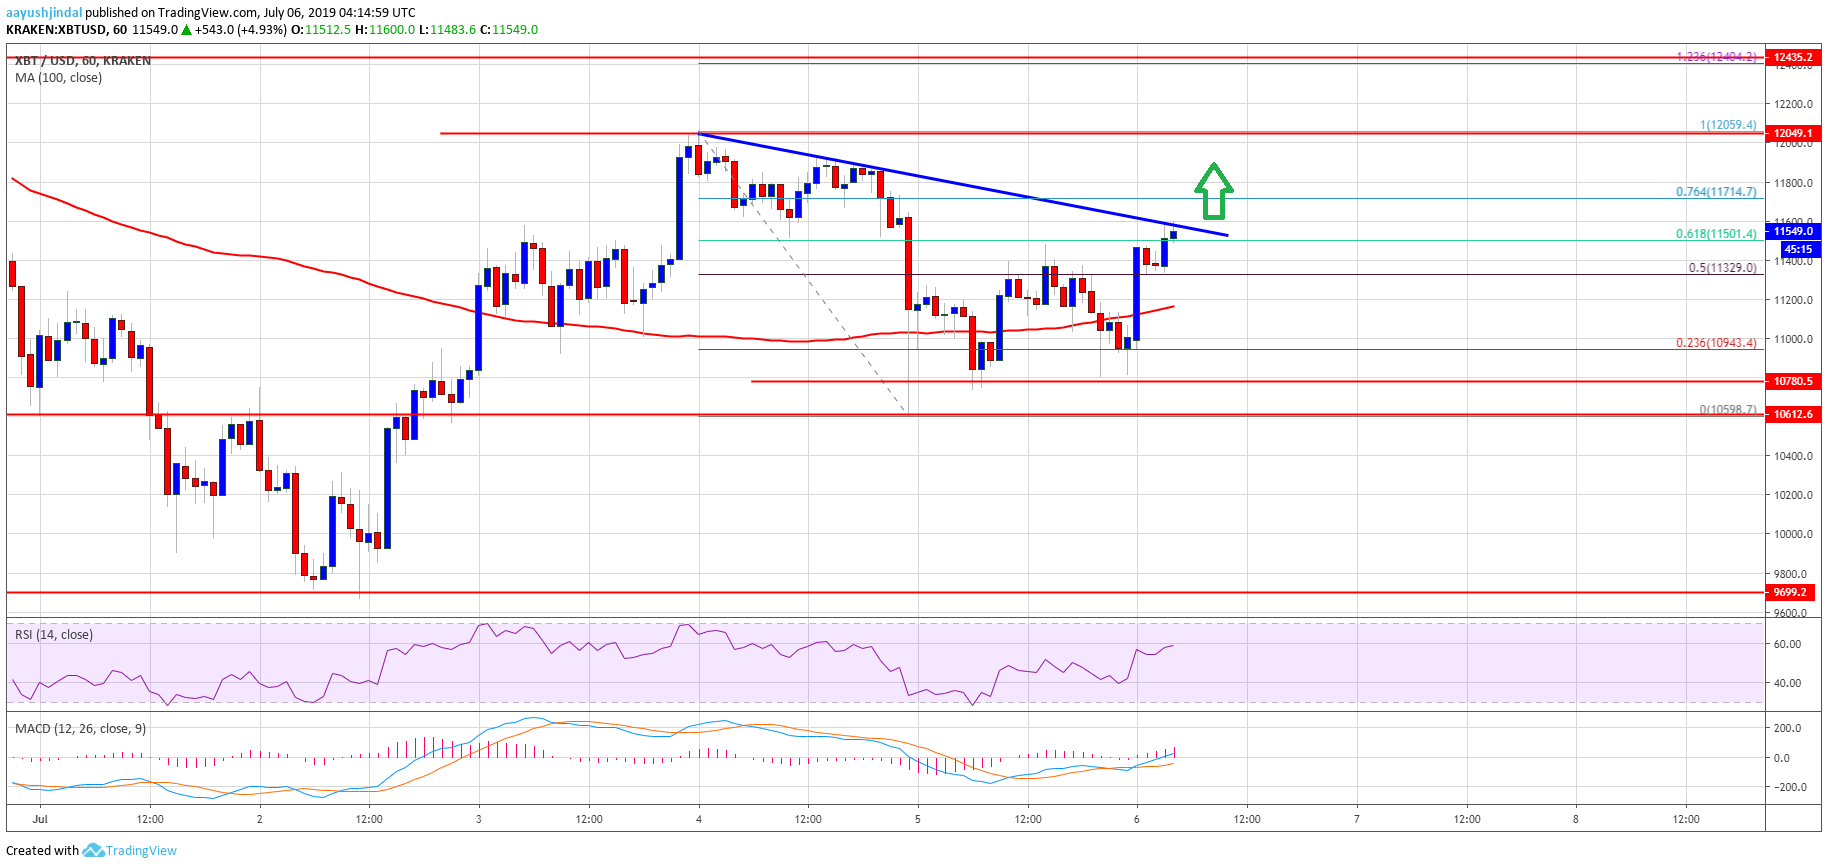
- There is a key bearish trend line forming with resistance near $11,600 on the hourly chart of the BTC/USD pair (data feed from Kraken).
- Ethereum is still trading below $300 and ripple price is struggling to climb higher.
Bitcoin price is showing positive signs above the $11,200 level against the US Dollar. BTC could surge higher once it breaks the $11,600 resistance level in the near term.
Bitcoin Price Analysis
Recently, we saw a downside correction in bitcoin price below $11,200 and $11,000 against the US Dollar. The BTC/USD pair spiked below the $10,800 level, but later recovered nicely. There was a successful close above the $11,000 pivot level to start a decent upward move. Besides, losses were limited in Ethereum, ripple and other altcoins, but they failed to climb similar to BTC.
The price is now trading nicely above the $11,200 level and the 100 hourly simple moving average. Moreover, there was a break above the 23.6% Fib retracement level of the last drop from the $12,055 swing high towards the $10,800 support area. The price is now trading above the $11,500 level, but facing resistance near the $11,600 level. Moreover, there is a key bearish trend line forming with resistance near $11,600 on the hourly chart of the BTC/USD pair.
Above the trend line, the next resistance is near the $11,700 level. The 76.4% Fib retracement level of the last drop from the $12,055 swing high towards the $10,800 support area is also near the $11,700 level. If there is an upside break above the $11,600 and $11,700 levels, there could be strong gains in the coming sessions. Bitcoin price could easily break the $11,800 and $12,000 levels to continue higher.
Conversely, if there is no upside break, the price may correct lower once again below $11,500 and $11,400. An initial support is near the $11,200 level, below which the price may perhaps test the $11,000 support area.
Looking at the chart, bitcoin price is clearly showing a lot of positive signs above $11,200 and $11,400 levels. Therefore, an upside break above $11,600 is very likely. If the bulls gain momentum, we may also witness a new swing high above the $12,000 level.
Technical indicators:
Hourly MACD – The MACD is slowly gaining pace in the bullish zone.
Hourly RSI (Relative Strength Index) – The RSI for BTC/USD is currently nicely above the 50 level, with a positive angle.
Major Support Levels – $11,400 followed by $11,200.
Major Resistance Levels – $11,600, $11,700 and $12,000.