
Reason to trust
How Our News is Made
Strict editorial policy that focuses on accuracy, relevance, and impartiality
Ad discliamer
Morbi pretium leo et nisl aliquam mollis. Quisque arcu lorem, ultricies quis pellentesque nec, ullamcorper eu odio.
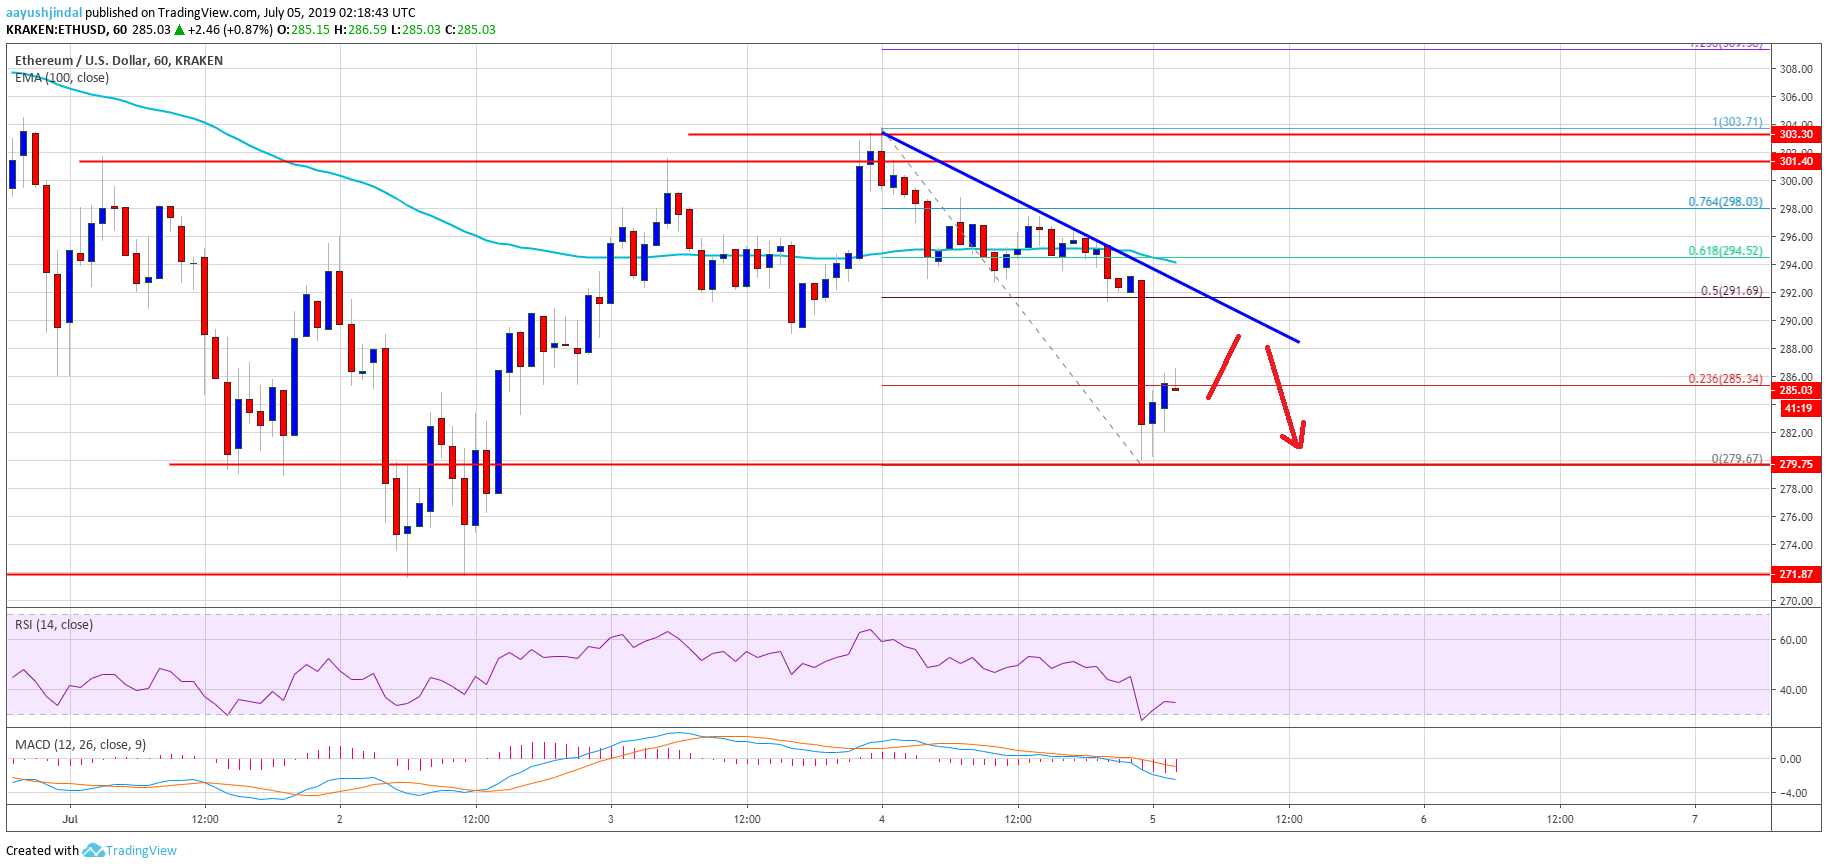
- ETH price failed to gain pace above the key $300 resistance area against the US Dollar.
- There was a sharp decline below the $290 and $295 support levels.
- There is a major bearish trend line forming with resistance near $290 on the hourly chart of ETH/USD (data feed via Kraken).
- The price is at risk of more losses below the $280 support level unless the price recovers above $290.
Ethereum price is under pressure below the $290 pivot level versus the US Dollar, and declined vs bitcoin. ETH price could continue to decline if the bulls fail to defend the $280 support.
Ethereum Price Analysis
After bitcoin failed to clear the $12,000 resistance, there was a downside push, dragging Ethereum lower against the US Dollar. Earlier, the ETH/USD pair climbed above the $300 level and formed a swing high near the $304 level. However, the price failed to gain pace above the key $300 resistance area. As a result, there was a bearish reaction and the price dipped below the $295 and $290 support levels.
Moreover, there was a close below the $290 support and the 100 hourly simple moving average. It even broke the $295 support and tested the $280 support. Ethereum is currently recovering and is trading near the $285 level. It seems like the 23.6% Fib retracement level of the recent dip from the $304 swing high to $280 low is acting as a resistance. On the upside, there are many resistances near the $290 level.
Besides, there is a major bearish trend line forming with resistance near $290 on the hourly chart of ETH/USD. The 50% Fib retracement level of the recent dip from the $304 swing high to $280 low is also near the $291 level to act as a strong resistance. The main resistance is now near the $295 level and the 100 hourly SMA. It also coincides with the 61.8% Fib retracement level of the recent dip from the $304 swing high to $280 low.
Therefore, the price is likely to struggle to clear the $290 and $295 resistance levels. On the downside, the $280 level is an initial support. If there is a downside break below the $280 support, the price could accelerate losses in the near term.
Looking at the chart, Ethereum price clearly declined after there was a strong dip in bitcoin price below $11,500. If BTC slides below $11,000, it could push ETH below the $280 support in the near term.
ETH Technical Indicators
Hourly MACD – The MACD for ETH/USD is currently gaining strength in the bearish zone.
Hourly RSI – The RSI for ETH/USD declined sharply below the 50 level and it is currently near 35.
Major Support Level – $280
Major Resistance Level – $290


