
Reason to trust
How Our News is Made
Strict editorial policy that focuses on accuracy, relevance, and impartiality
Ad discliamer
Morbi pretium leo et nisl aliquam mollis. Quisque arcu lorem, ultricies quis pellentesque nec, ullamcorper eu odio.
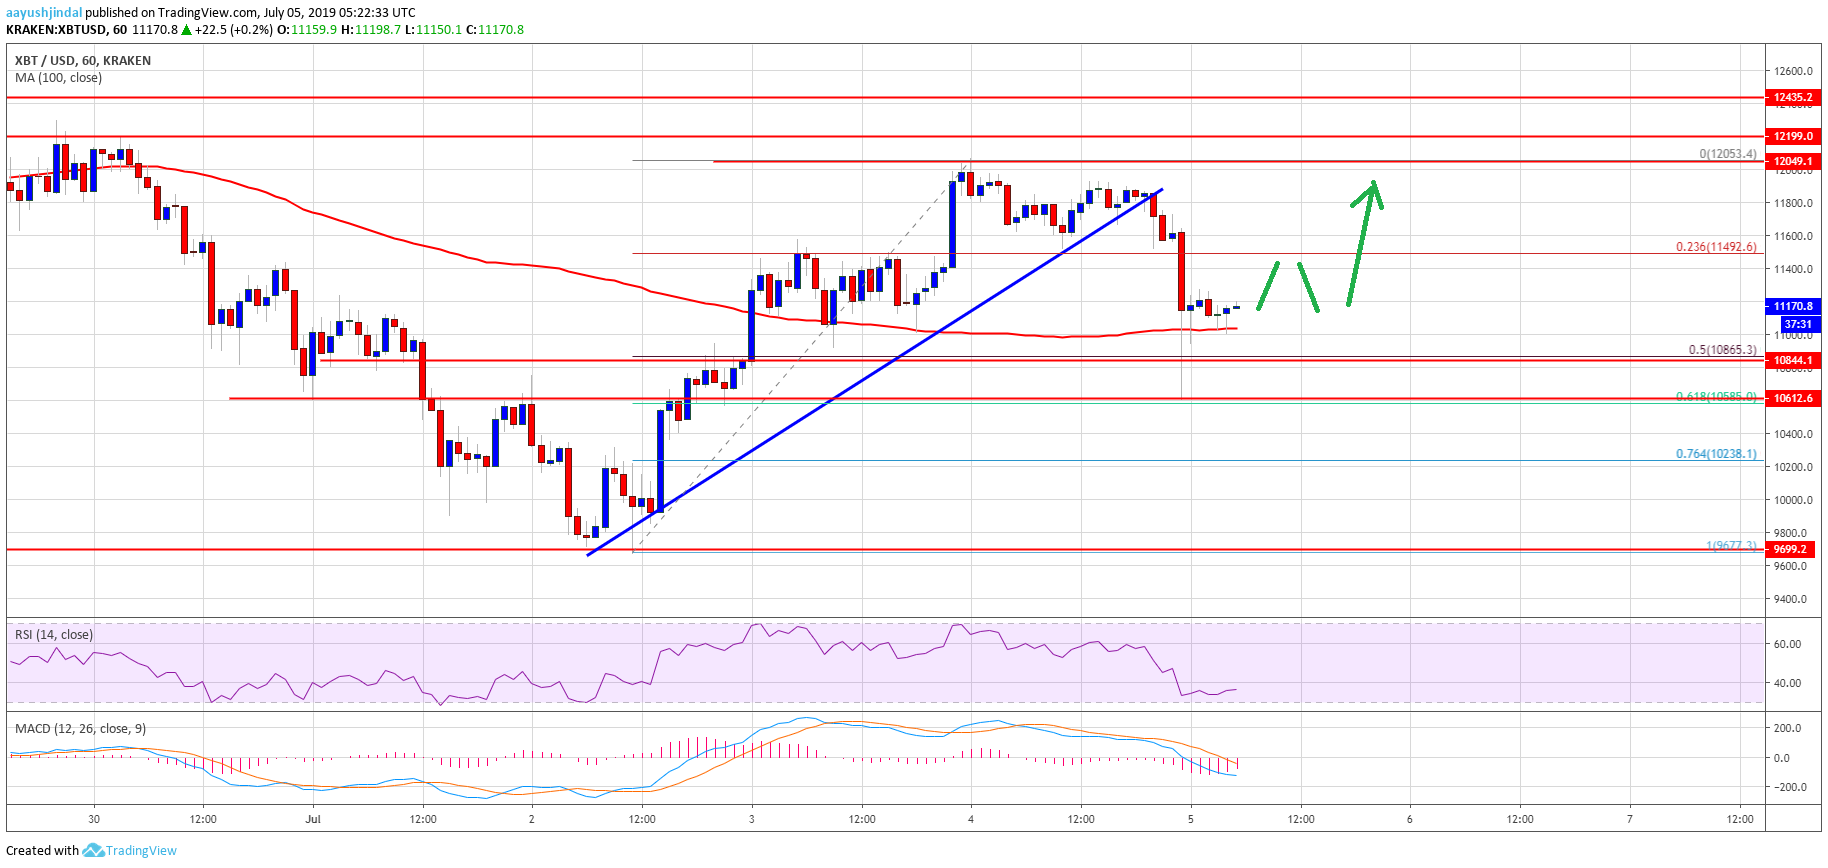
- After a strong rejection near $12,000, bitcoin price started a fresh decline against the US Dollar.
- A swing high was formed near $12,053 and recently declined below $11,800 and $11,400.
- There was a break below a major bullish trend line with support near $11,840 on the hourly chart of the BTC/USD pair (data feed from Kraken).
- The pair tested the $10,800 support level and it remains well supported for more gains.
Bitcoin price started a fresh decline below the $11,800 support against the US Dollar. BTC is currently holding a few key supports and it could rise again above $11,800.
Bitcoin Price Analysis
Recently, there was a decent upward move in bitcoin price above $11,200 and $11,800 against the US Dollar. The BTC/USD pair even climbed above the $12,000 resistance and the 100 hourly simple moving average. However, the price struggled to remain above the $12,000 level and formed a swing high at $12,053. As a result, there was a downside correction below the $11,800 and $11,600 support levels.
There was a break below the 23.6% Fib retracement level of the last upward move from the $9,677 low to $12,053 high. Additionally, there was a break below a major bullish trend line with support near $11,840 on the hourly chart of the BTC/USD pair. Moreover, the pair spiked below the $11,000 support and the 100 hourly simple moving average. However, the $10,800 level acted as a strong support base.
Besides, the 50% Fib retracement level of the last upward move from the $9,677 low to $12,053 high prevented more losses. The price is currently trading above the $11,000 level and the 100 hourly simple moving average. It seems like the current price action, there are chances of a fresh increase above the $11,400 and $11,500 resistance levels.
On the upside, the main resistances are near the $11,800 and $12,000 levels. A break above the $12,053 swing high, the price could continue to rise towards the $12,250 and $12,400 levels. On the downside, a close below the $10,800 support level might negate the current bullish view. The next main support is near $10,580 level or the 61.8% Fib retracement level of the last upward move from the $9,677 low to $12,053 high.
Looking at the chart, bitcoin price is holding a few important supports near the $10,800 and $11,000 levels. In the short term, there could be a few range moves before the price either climbs above $11,500 or revisits $10,800 and $10,580.
Technical indicators:
Hourly MACD – The MACD is slowly reducing its recent bearish slope.
Hourly RSI (Relative Strength Index) – The RSI for BTC/USD is currently below the 40 level, with a few positive signs.
Major Support Levels – $11,000 followed by $10,800.
Major Resistance Levels – $11,500, $11,800 and $12,000.


