
Reason to trust
How Our News is Made
Strict editorial policy that focuses on accuracy, relevance, and impartiality
Ad discliamer
Morbi pretium leo et nisl aliquam mollis. Quisque arcu lorem, ultricies quis pellentesque nec, ullamcorper eu odio.
- A strong support base is forming near the $9,700 level after a strong decline.
- A swing low was formed at $9,679 before the price started a strong upward move.
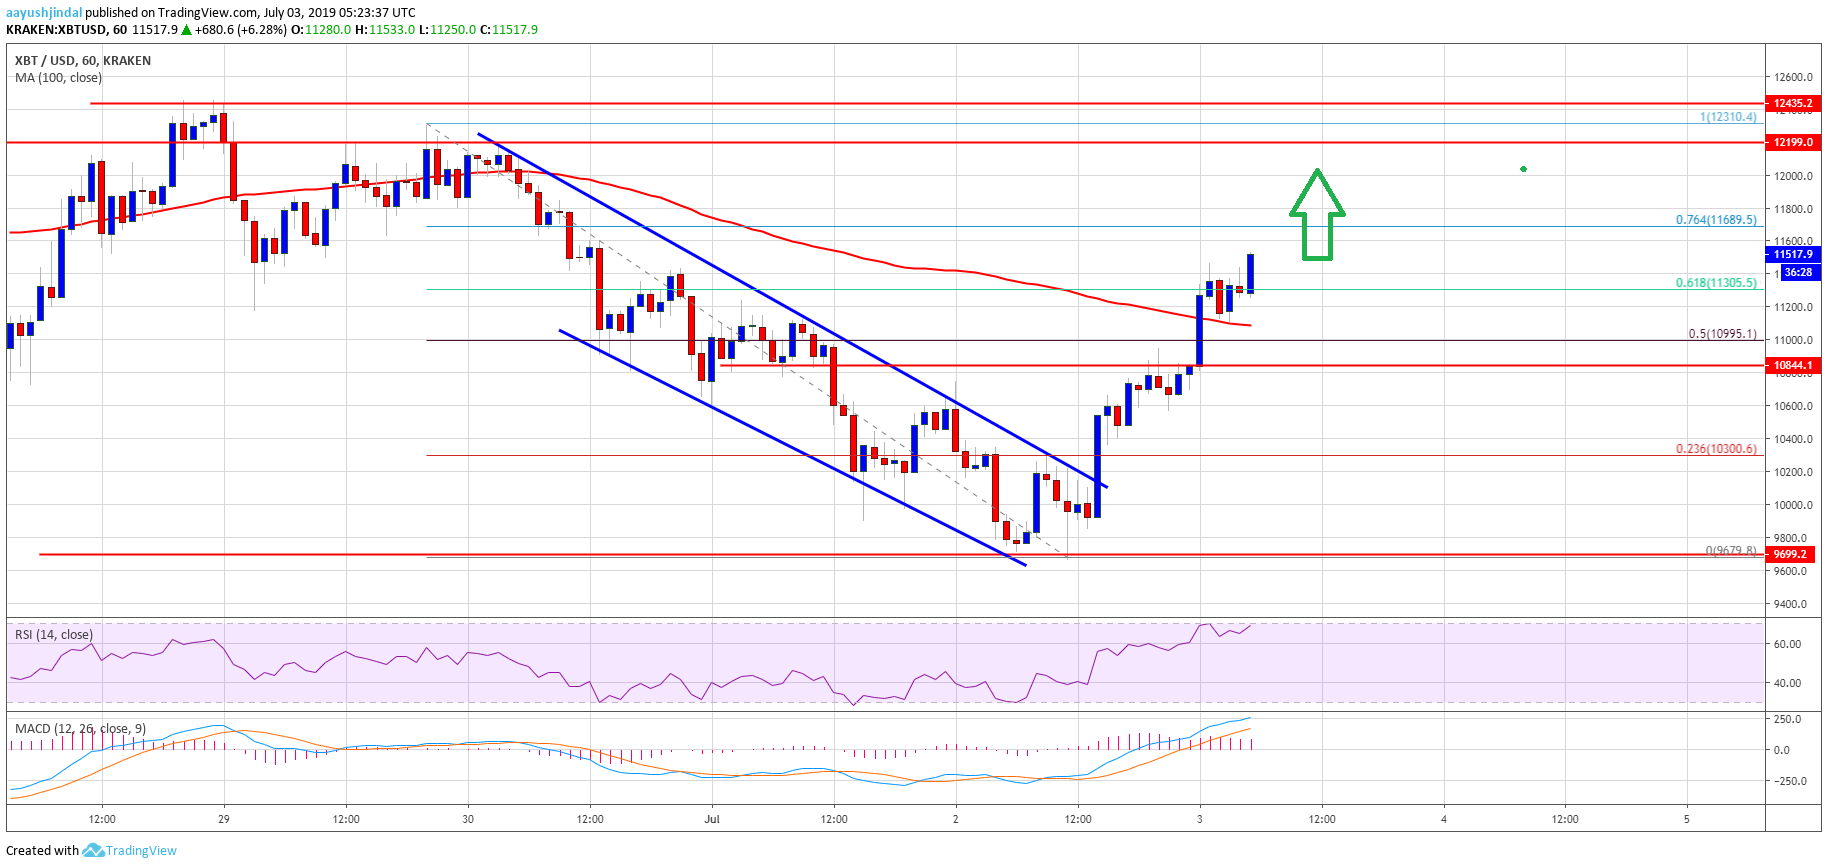
- Yesterday’s crucial declining channel was breached with resistance near $10,120 on the hourly chart of the BTC/USD pair (data feed from Kraken).
- The pair is currently gaining momentum above $11,200 and it could accelerate towards $12,000.
There was a strong bounce in bitcoin price above the $11,000 level against the US Dollar. BTC price is up more than 10% and it could continue to rise towards $12,000 in the near term.
Bitcoin Price Analysis
Yesterday, there was a downside extension below $10,000 in bitcoin price against the US Dollar. The BTC/USD pair traded to a new monthly low at $9,679 before the bulls took a stand. There was a major reversal pattern formed and the price climbed sharply above the $10,000 and $10,500 resistance levels. It even cleared the $10,850 resistance area and the 100 hourly simple moving average.
Moreover, yesterday’s crucial declining channel was breached with resistance near $10,120 on the hourly chart of the BTC/USD pair. The pair surged above the 50% Fib retracement level of the last major drop from the $12,310 high $9,679 swing low. It is now trading nicely above the $11,400 level and the 100 hourly SMA. An immediate resistance is near the $11,700 level.
Moreover, the 76.4% Fib retracement level of the last major drop from the $12,310 high $9,679 swing low might act as a resistance. If there is an upside break above the $11,700 level, bitcoin price is likely to test the $12,000 resistance. Any further gains could push the price towards the key $12,500 resistance area.
On the downside, an immediate support is near the $11,400 level. However, the main support is near the $11,200 level and the 100 hourly simple moving average. If the price fails to stay above the 100 hourly simple moving average, it could correct lower towards the $10,800 support area. Any further losses might push the price back towards the $10,200 support area.
 btc
btc
Looking at the chart, bitcoin price is clearly surging and it seems like a fresh bottom is in place near $10,000. If it clears the $12,000 level, it will be a strong bullish signal. In the mentioned case, the price could continue to rise towards the last major swing high near $13,500.
Technical indicators:
Hourly MACD – The MACD is gaining pace in the bullish zone.
Hourly RSI (Relative Strength Index) – The RSI for BTC/USD is now well above the 55 level, with a bullish angle.
Major Support Levels – $11,400 followed by $11,200.
Major Resistance Levels – $11,700, $12,000 and $12,200.