Reason to trust
How Our News is Made
Strict editorial policy that focuses on accuracy, relevance, and impartiality
Ad discliamer
Morbi pretium leo et nisl aliquam mollis. Quisque arcu lorem, ultricies quis pellentesque nec, ullamcorper eu odio.
- ETH price struggled to climb above the $300 resistance level and declined against the US Dollar.
- Bitcoin price broke the $10,000 support area, resulting in bearish moves in the market.
- There was a break above a connecting bearish trend line with resistance near $289 on the hourly chart of ETH/USD (data feed via Kraken).
- The pair is struggling to recover and it might slide below the $278 and $275 support levels.
Ethereum price is facing a lot of hurdles versus the US Dollar and bitcoin. ETH price must break the $296 and $300 resistance levels to start a decent recovery.
Ethereum Price Analysis
Yesterday, there was a minor recovery in Ethereum price above the $290 level against the US Dollar. The ETH/USD pair made a couple of attempts to settle above the $300 handle. However, the bulls failed to gain momentum above $300 and $302. There was also no proper close above $302 and break above the 100 hourly simple moving average.
As a result, there was a fresh decline in Ethereum below the $290 support. Moreover, the price even broke the $280 support and traded close to the $275 support area. A swing low was formed near $278 and the price is currently correcting higher. It broke the $290 level and the 23.6% Fib retracement level of the last slide from the $232 high to $278 low. Moreover, there was a break above a connecting bearish trend line with resistance near $289 on the hourly chart of ETH/USD.
However, the price seems to be facing a lot of hurdles near $295-296. It is even struggling to hold gains above the broken trend line and $285. On the upside, the bulls are likely to struggle near $295, $296 and $300. Besides, the price must settle above the $302 level plus the 100 hourly SMA to move back in a positive zone. The 50% Fib retracement level of the last slide from the $232 high to $278 low is also near the $301 level.
If Ethereum price fails to climb above $300 and $302, there could be extended losses. An immediate support is near the $278 level, below which the price may even break the $275 support.
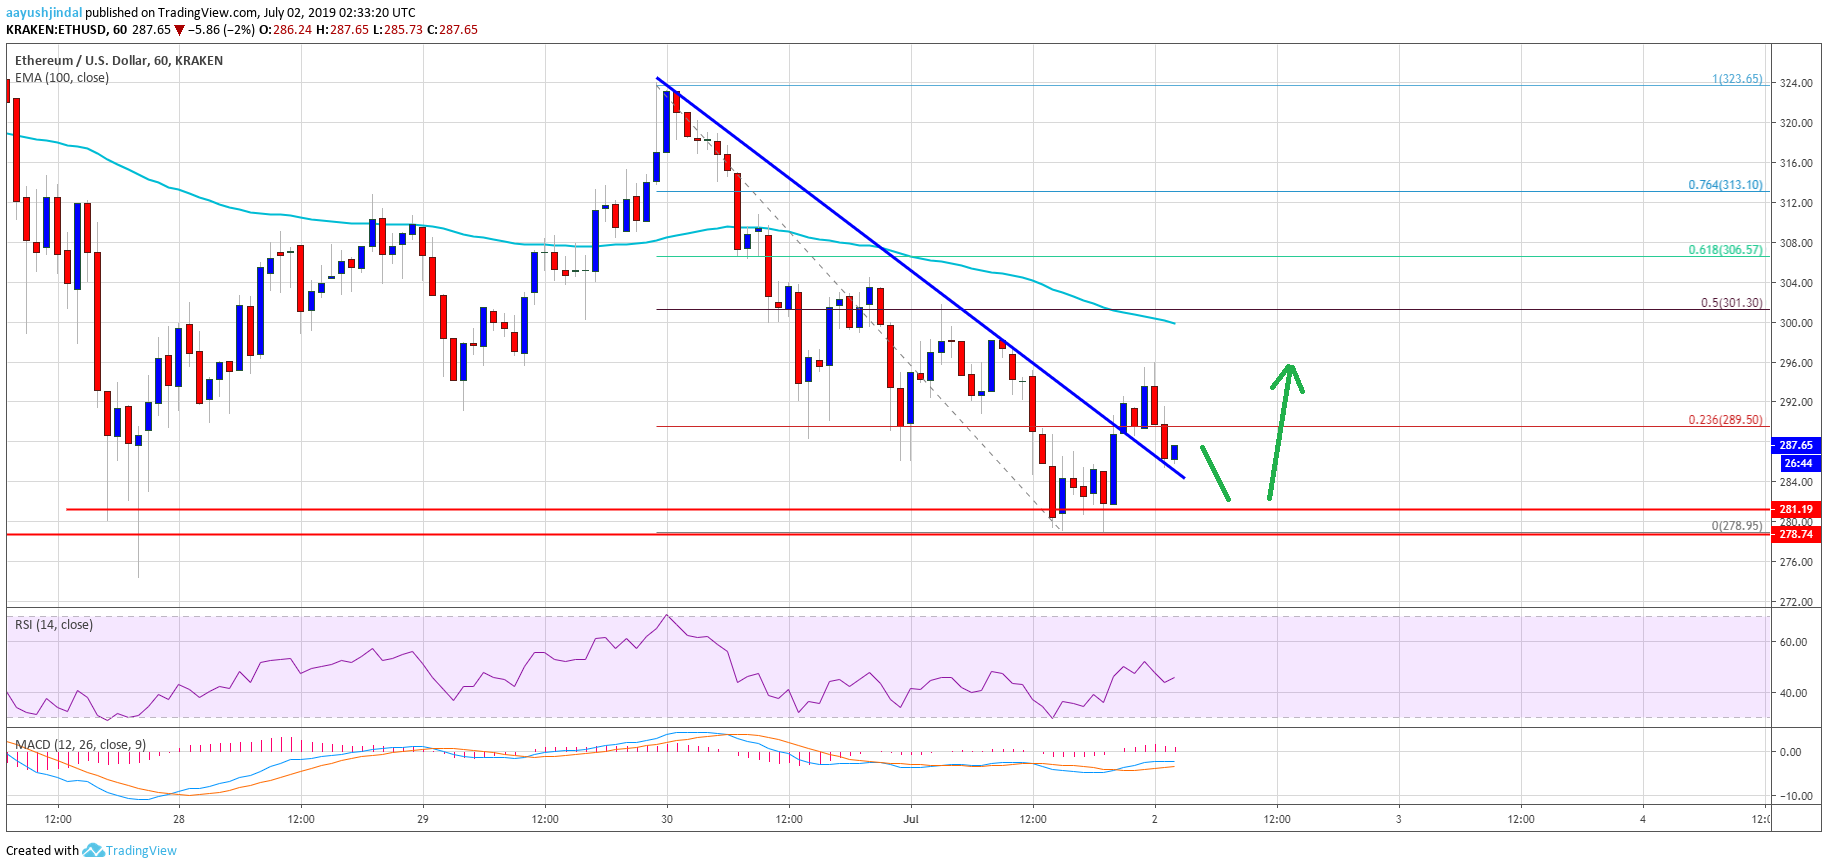
Looking at the chart, Ethereum price is clearly trading in a bearish zone below the $300 resistance area. Therefore, there are high chances of a fresh decline below the $275 support area. The next major supports are near the $268 and $265 levels.
ETH Technical Indicators
Hourly MACD – The MACD for ETH/USD is struggling to gain traction in the bullish zone.
Hourly RSI – The RSI for ETH/USD is still well below the 50 level.
Major Support Level – $275
Major Resistance Level – $300