
Reason to trust
How Our News is Made
Strict editorial policy that focuses on accuracy, relevance, and impartiality
Ad discliamer
Morbi pretium leo et nisl aliquam mollis. Quisque arcu lorem, ultricies quis pellentesque nec, ullamcorper eu odio.
- There were continuous losses in bitcoin price below the $10,500 support against the US Dollar.
- The price even broke the key $10,000 support and traded to a new weekly low.
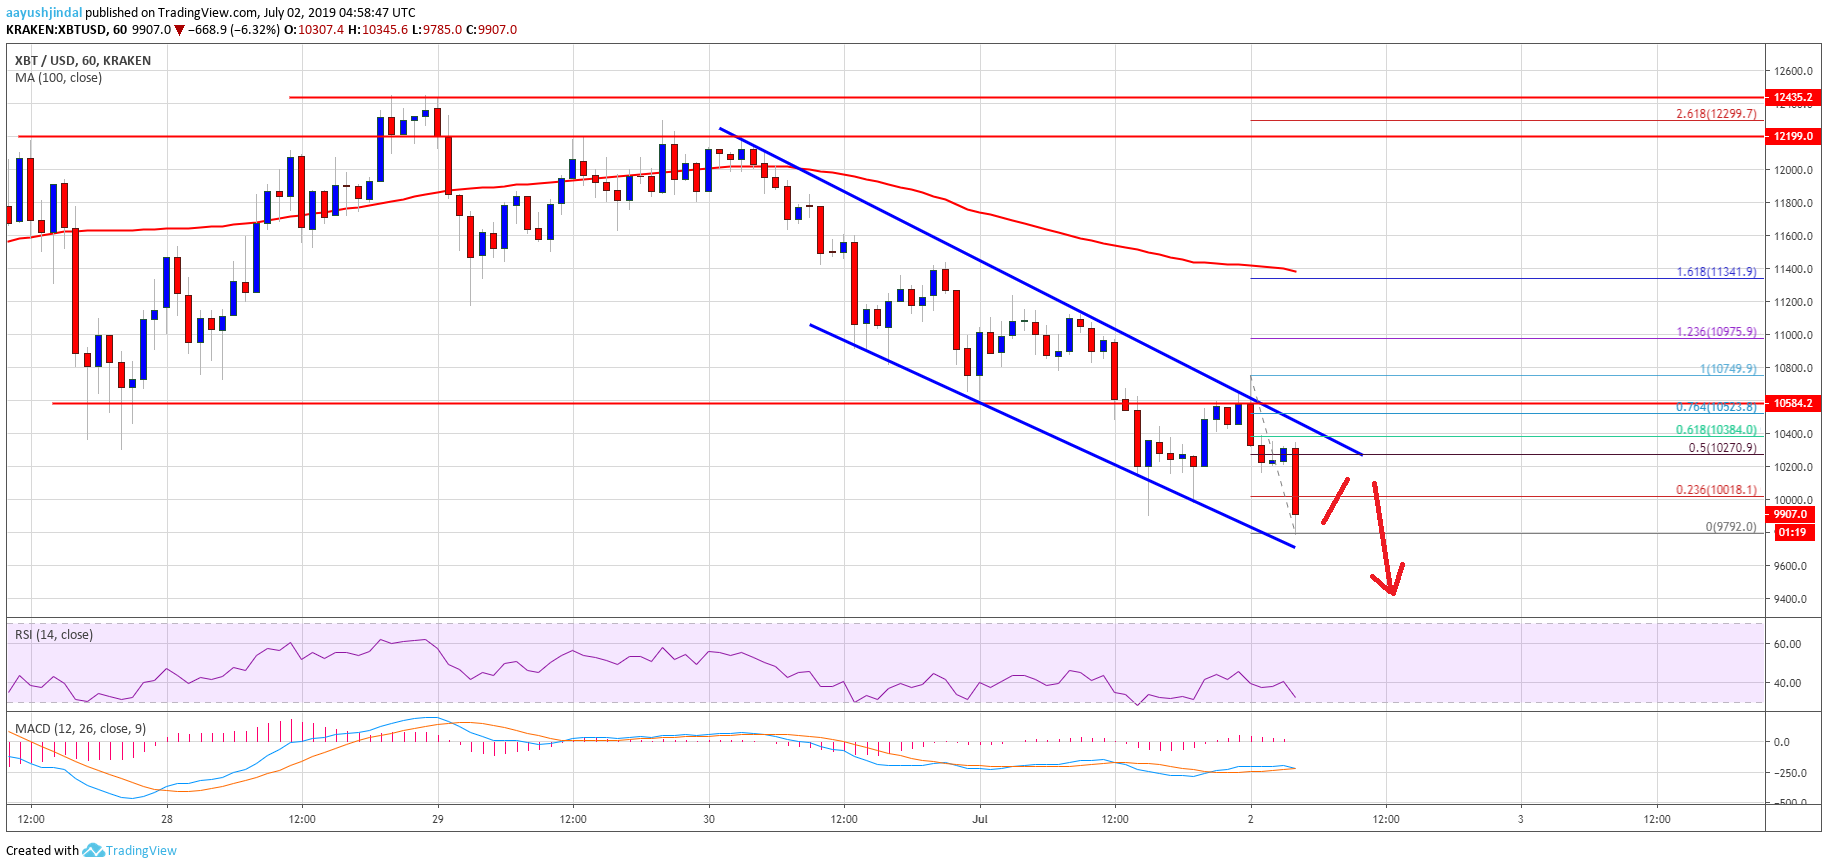
- There is a major declining channel forming with resistance near $10,270 on the hourly chart of the BTC/USD pair (data feed from Kraken).
- The pair remains at a risk of more losses and it could break the $9,500 support area.
There were additional bearish moves in bitcoin below the $10,500 support against the US Dollar. BTC price is down more than 10% and it could continue lower towards $9,200.
Bitcoin Price Analysis
Yesterday, there was a minor upside correction above the $10,600 level. However, bitcoin price failed to gain momentum above the $11,000 level against the US Dollar. As a result, there was a fresh decline and the BTC/USD pair traded below the $10,800 and $10,500 support levels. More importantly, there was a break below the $10,200 support and the 100 hourly simple moving average.
Finally, there was a break below the $10,000 support and the price traded to a new below $9,800. The recent swing low was formed at $9,792 and the price remains at a risk of more losses. On the upside, an initial resistance is near the $10,100 level or the 23.6% Fib retracement level of the recent decline from the $10,749 high to $9,792 low. However, the main resistances are near the $10,200 and $10,250 levels.
Moreover, there is a major declining channel forming with resistance near $10,270 on the hourly chart of the BTC/USD pair. The 50% Fib retracement level of the recent decline from the $10,749 high to $9,792 low is also near the channel resistance. Therefore, the price must break the channel resistance and settle above $10,400 to start a decent recovery. The next key resistances are near $10,550 and $10,600.
On the downside, an immediate support is near the $9,750 level. If there is a downside break, the price could even break the $9,600 and $9,500 support levels. The next support is near $9,420, below which the bears might aim the $9,200 support area.
Looking at the chart, bitcoin price is clearly under a lot of pressure below $10,200. There are chances of more downsides below $9,700 and $9,500. Only a close above the $10,250 level and a follow through above $10,400 might decrease the possibility of more downsides towards the $9,200 level.
Technical indicators:
Hourly MACD – The MACD is gaining pace in the bearish zone.
Hourly RSI (Relative Strength Index) – The RSI for BTC/USD is now well below the 40 level, with a bearish angle.
Major Support Levels – $9,700 followed by $9,420.
Major Resistance Levels – $10,200, $10,250 and $10,400.


