
Reason to trust
How Our News is Made
Strict editorial policy that focuses on accuracy, relevance, and impartiality
Ad discliamer
Morbi pretium leo et nisl aliquam mollis. Quisque arcu lorem, ultricies quis pellentesque nec, ullamcorper eu odio.
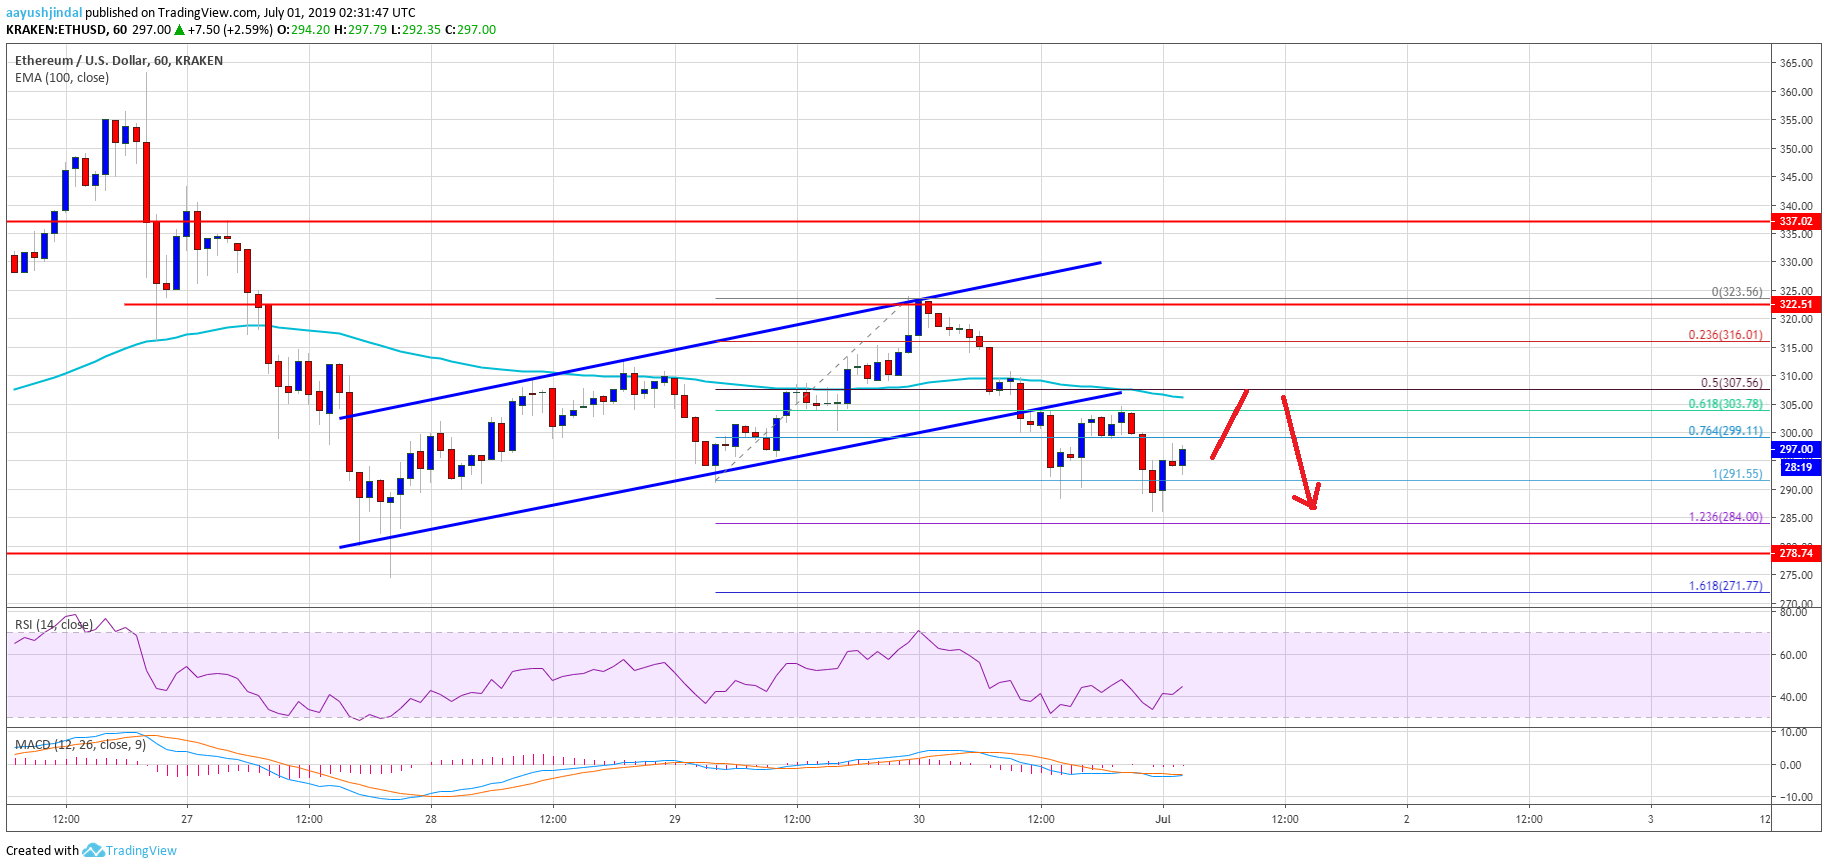
- ETH price failed to break the $322 resistance area and declined again against the US Dollar.
- The price broke the $310 support area and even tested the $290 support level.
- There was a break below a major ascending channel with support near $303 on the hourly chart of ETH/USD (data feed via Kraken).
- Similarly, there were losses noted in bitcoin, ripple, BCH, EOS and a few others.
Ethereum price struggled to remain above the $310 and $315 levels versus the US Dollar, and declined vs bitcoin. ETH price is currently holding $290, but facing many hurdles.
Ethereum Price Analysis
After testing the $275 support area, Ethereum price started an upside correction above $300 against the US Dollar. The ETH/USD pair broke the $310 resistance and the 100 hourly simple moving average. It even surpassed the $320 level, but it seems like the $322-323 zone acted as a major hurdle. A swing high was formed near $323 and recently the price started a fresh decline.
It traded below the key $315 and $310 support levels. During the decline, there was a break below a major ascending channel with support near $303 on the hourly chart of ETH/USD. Moreover, there was a break below the 76.4% Fib retracement level of the upward move from the $291 low to $323 high. The price is currently trading near the last swing low at $291 and is holding the $290 support level.
If there are more losses, the price could test the $284 support area. It represents the 1.236 Fib extension level of the upward move from the $291 low to $323 high. If there are more losses, the price may even revisit the key $275 support area in the near term.
On the upside, there are many hurdles near the $300 and $305 levels. The main resistance is near the $305 level and the 100 hourly SMA. A successful close above the 100 hourly SMA might start a decent recovery above $310. The next main hurdle for the bulls is near the $320 and $323 levels. If the price climbs above the last swing high at $323, it may perhaps rise towards the $350 level.
Looking at the chart, Ethereum price is clearly holding a couple of important supports, similar to bitcoin (above $10,500). However, on the upside, there are many resistances near $305, $310 and $320. As long as the price is below the mentioned levels, it could decline towards $275.
ETH Technical Indicators
Hourly MACD – The MACD for ETH/USD is slowly moving in the bullish zone.
Hourly RSI – The RSI for ETH/USD is recovering from 30 and it is currently near 45.
Major Support Level – $284
Major Resistance Level – $305


