
Reason to trust
How Our News is Made
Strict editorial policy that focuses on accuracy, relevance, and impartiality
Ad discliamer
Morbi pretium leo et nisl aliquam mollis. Quisque arcu lorem, ultricies quis pellentesque nec, ullamcorper eu odio.
- There was another rejection near the $12,200 resistance in bitcoin price against the US Dollar.
- The price revisited the main $10,500 support area and it is currently correcting higher.
- There is a key connecting bearish trend line forming with resistance near $11,400 on the hourly chart of the BTC/USD pair (data feed from Kraken).
- The pair seems to be forming a double bottom pattern near the $10,400 and $10,500 support levels.
Bitcoin price is holding the main $10,400 support area against the US Dollar. BTC price might start a strong increase if it clears the $11,400 resistance area.
Bitcoin Price Analysis
Recently, there was a decent recovery in bitcoin price above the $11,500 level against the US Dollar. The BTC/USD pair even traded above the $12,000 level and the 100 hourly simple moving average. However, the pair struggled to clear the $12,200 resistance area and it recently declined below $12,000 and $11,500. There was even a spike below the $11,000 level and the price settled below the 100 hourly SMA.
However, the main $10,400 and $10,500 support levels acted as a strong hurdle for sellers. Bitcoin remained above the $10,400 support and it seems to be forming a double bottom pattern. It is currently correcting higher above $11,000 plus the 23.6% Fib retracement level of the last decline from the $12,305 high to $10,616 low. On the upside, there is a major resistance forming near the $11,400 level.
Moreover, there is a key connecting bearish trend line forming with resistance near $11,400 on the hourly chart of the BTC/USD pair. The 50% Fib retracement level of the last decline from the $12,305 high to $10,616 low is also near the $10,460 level to act as a resistance. Finally, the 100 hourly simple moving average is near the $11,650 level to act as a strong resistance.
Once there is a close above the trend line and the 100 hourly SMA, the price could revisit the $12,200 level. On the downside, an initial support is near the $11,000 level, below which there is a risk of a drop towards the $10,600 level. The main support is near the $10,400 level, below which the price could accelerate losses.
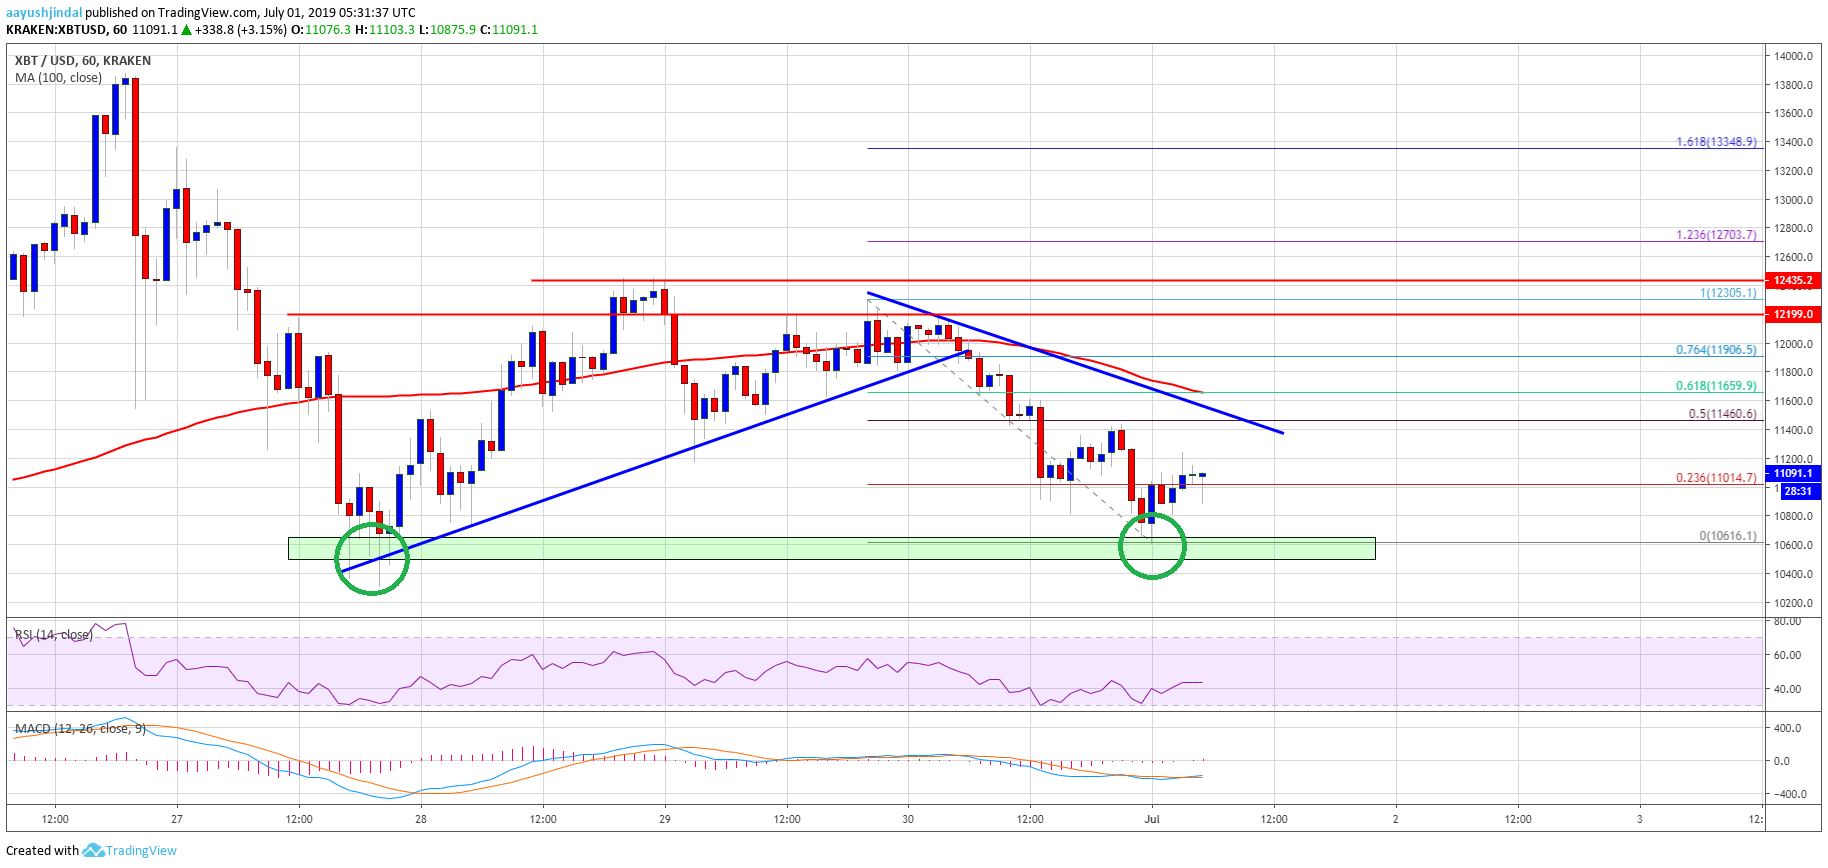
Looking at the chart, bitcoin price is likely forming a double bottom pattern near the $10,400 and $10,500 support levels. As long as it stays above the $10,400 level, there could be a fresh increase above the $11,500 and $11,650 levels.
Technical indicators:
Hourly MACD – The MACD is likely to move into the bullish zone.
Hourly RSI (Relative Strength Index) – The RSI for BTC/USD is just above the 40 level, with a positive angle.
Major Support Levels – $10,600 followed by $10,400.
Major Resistance Levels – $11,400, $11,650 and $12,200.